You have a giant prospecting spreadsheet with thousands of leads consolidated from various lists you bought off the shelf or exported from your multiple CRMs. However, Managing inconsistent metadata formats, dealing with duplicates, and ensuring data quality can quickly become overwhelming. You know thoroughly qualifying your leads is essential, but the process is resource-intensive, making it difficult to execute effectively… until now!
Use GPT for Sheets or Excel's Custom prompt bulk tool to automatically score, grade, and qualify leads for B2B sales. With GPT for Work, you can quickly and reliably classify leads regardless of volume, format, or data complexity.
By the end of this guide, you will know:
- The differences between lead scoring, grading, and qualifying, and how they can improve your sales outcomes.
- How to automatically process leads based on your lead data using GPT for Sheets or Excel.
- How to use the
Custom promptbulk tool in GPT for Sheets or Excel. - Some key strategies for improving your lead management results.
Why use GPT for Sheets or Excel to grade, score, and qualify sales leads?
GPT for Sheets or Excel provides a highly efficient way to manage and analyze your sales leads, offering several advantages over traditional manual processes.
- Unified scoring, grading, and qualifying: By leveraging GPT for Work, you can automatically assess a lead’s interest level, fit within your ideal customer profile, and readiness to convert in just a few clicks.
- Bulk analysis: With GPT for Sheets or Excel, you can classify large volumes of leads at scale, regardless of data format or complexity. This saves time and ensures consistent, data-driven decisions across the sales funnel.
- Flexible categorization: Unlike fixed categories in CRM systems, you can create and modify lead evaluation criteria on the fly, adapting to new insights or changing business needs.
- Integration with existing tools: Never leave your spreadsheet. Leverage your skills and combine your lead analysis with built-in data visualization and pivot table features for deeper insights.
Understanding lead scoring, grading, and qualifying
Before we start the tutorial, let's clarify the key differences between lead scoring, grading, and qualifying:
Lead scoring is based on behaviors. It quantifies a lead's interest level based on their interactions with your brand. Lead grading is based on demographics. It assesses how well a lead fits your ideal customer profile. Lead qualifying is based on the lead's readiness and fit. A common way of representing this is tagging each lead as Hot, Warm, or Cold based on their conversion likelihood.
Scoring and qualifying leads is a simple process that helps ensure your sales team doesn't contact a lead who isn't ready to make a decision. Combining these three aspects of evaluating leads creates a comprehensive lead management system.
Implementing lead management with GPT for Work
Prerequisites
To begin this tutorial, you need to complete the following prerequisites:
- Install GPT for Sheets or GPT for Excel
- Copy the appropriate template:
- For Google Sheets, click USE TEMPLATE: Scoring and Qualifying Leads Tutorial for Sheets with gptforwork.com
- For Microsoft Excel, click File > Download the .xlsx file in your computer, and open the .xlsx file in Microsoft Excel: Scoring and Qualifying Leads Tutorial for Excel with gptforwork.com
- Or you have opened a spreadsheet containing lead data including company information, demographics and behavior, and current status.
Getting started in GPT for Sheets
Open GPT for Sheets using the Extensions menu at the top of your document.
Note: You can also complete this tutorial in Excel. While the Excel version has been slightly modified due to formatting limitations between Sheets and Excel, the differences are purely cosmetic and do not affect the content or functionality of the tutorial. Other differences between the tutorials are noted below.
Selecting a model
In the GPT for Sheets sidebar, check that the model is set to gpt-4o. If not, open the model switcher dropdown and select **gpt-4o.
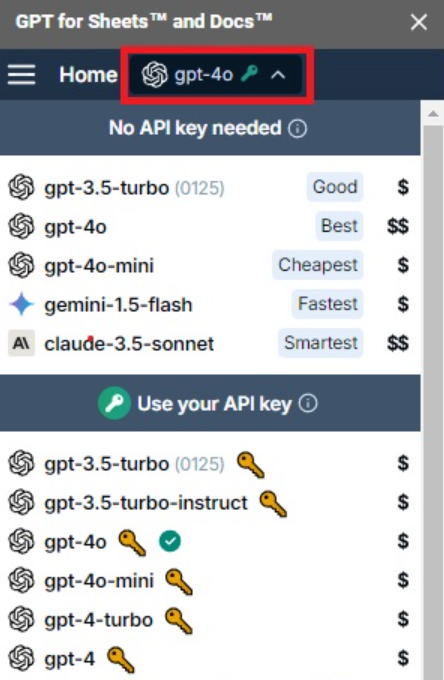
We recommend using gpt-4o to complete this tutorial because it balances cost and accuracy well.
You can try gpt-4o-mini to take advantage of substantial cost savings. However, to achieve similar accuracy to gpt-4o, gpt-4o-mini requires more precise and longer custom instructions.
Feel free to try out some different models and compare your results!
Grading leads
To grade leads, we will analyze demographic information.
From the Bulk tools tab, select the Custom prompt bulk tool.
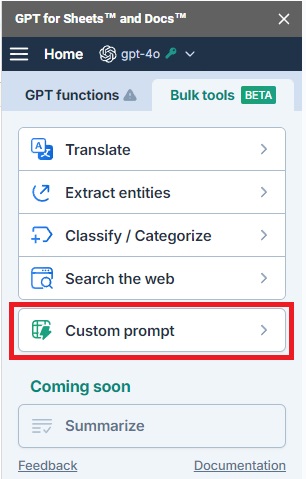
Note: If you are using your own file or need help getting started, refer to our Custom prompt bulk tool guides for GPT for Sheets and GPT for Excel.
Paste the following prompt (also found in cell N2).
Assign a Lead Grade of A, B, or C based on the following lead data:

Company Name: {{B}}
Industry: {{C}}
Company Size: {{D}}
Decision Maker: {{E}}
Job Title: {{F}}

Please only print the letter grade.
Select the column where you want the results to appear (column N).
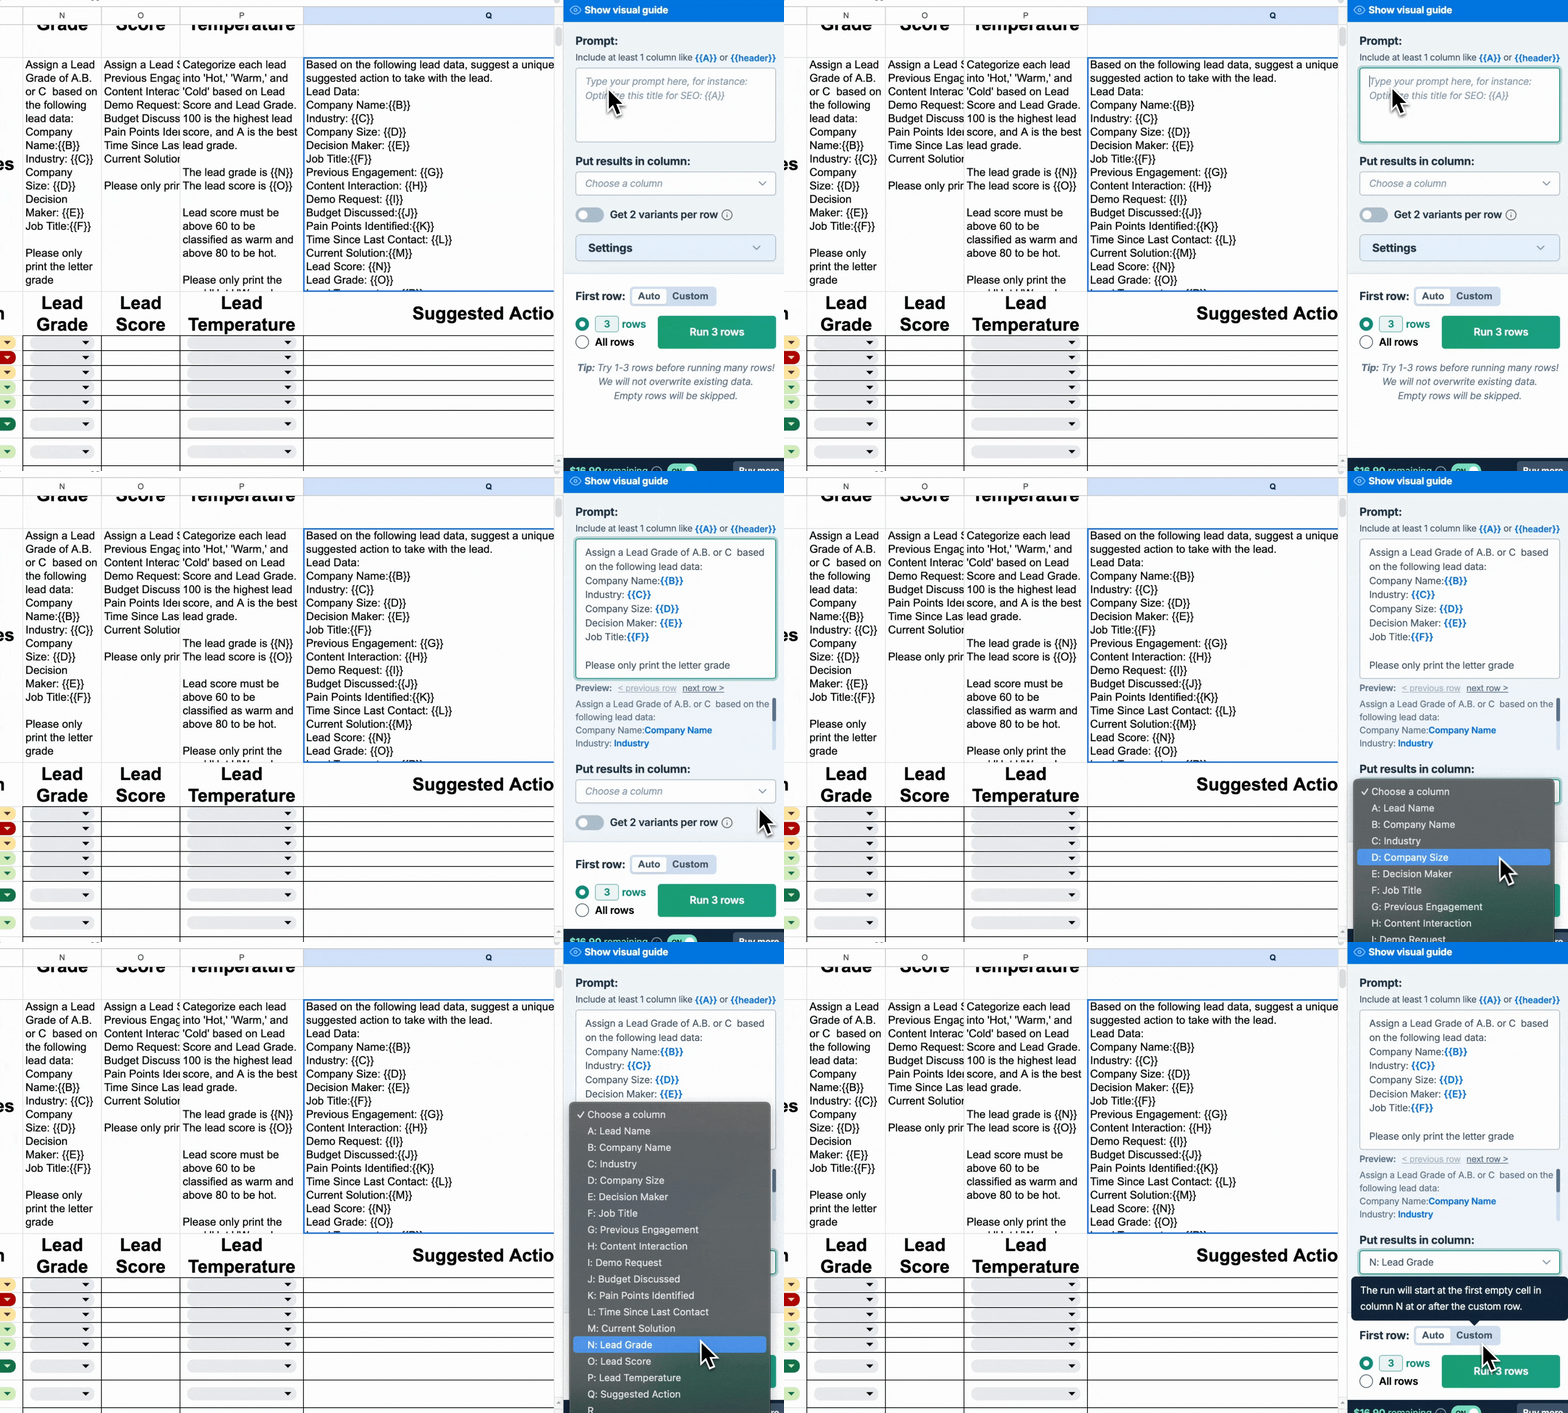
Set the first row to 4. Then, run the first three rows to test the classification and check the result (it will run the following three empty rows starting from row 4).
If satisfactory, run all rows to grade leads.
Scoring leads
To score leads, we will analyze all behavioral information.
Paste the following prompt(also found in cell O2).
Assign a Lead Score from 0-100 based on the following lead data:

Previous Engagement: {{G}}
Content Interaction: {{H}}
Demo Request: {{I}}
Budget Discussed: {{J}}
Pain Points Identified: {{K}}
Time Since Last Contact: {{L}}
Current Solution: {{M}}

Please only print the numerical score.
Select the column where you want the results to appear (column O)
Note: You can move your columns with custom prompts. Simply target your column header (the text in row 1) in your prompt like so:
Assign a Lead Score from 0-100 based on the following lead data:

Previous Engagement: {{Previous Engagement}}
Content Interaction: {{Content Interaction}}
Demo Request: {{Demo Request}}
Budget Discussed: {{Budget Discussed}}
Pain Points Identified: {{Pain Points Identified}}
Time Since Last Contact: {{Time Since Last Contact}}
Current Solution: {{Current Solution}}

Please only print the numerical score.
You can then move your columns around as you please and run or re-run your prompt as many times as you wish.
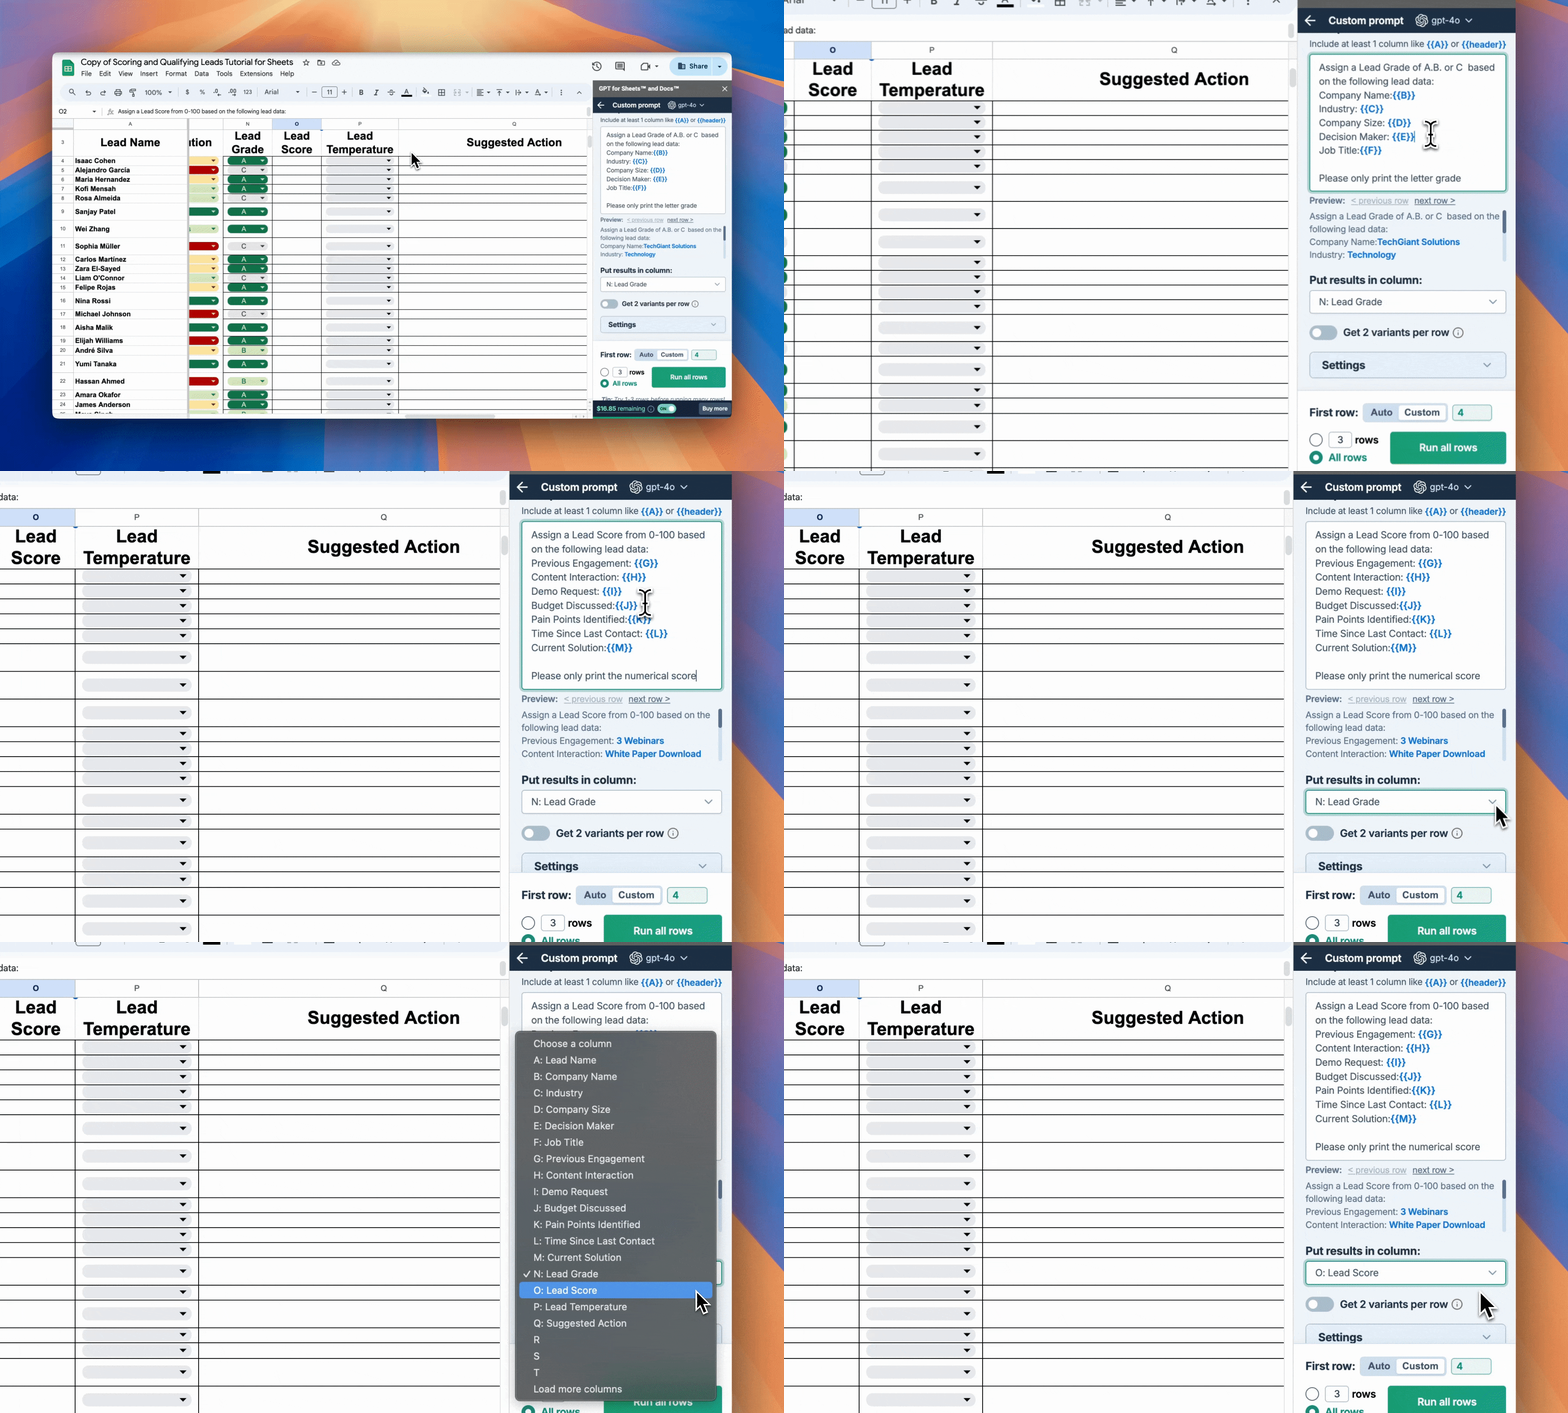
Ensure the prompt works by testing it on the first three rows. If satisfactory, run all rows to score leads.
Qualify leads
We will analyze the scores and grades we just generated to qualify leads.
Paste the following prompt (also found in P2)
Categorize each lead into 'Hot,' 'Warm,' and 'Cold' based on Lead Score and Lead Grade. 100 is the highest lead score, and A is the best lead grade.

The lead grade is {{N}}
The lead score is {{O}}

Lead score must be above 60 to be classified as warm and above 80 to be hot.

Please only print the word 'Hot,' 'Warm,' or 'Cold' as output.
Select the column where you want the results to appear (column P).
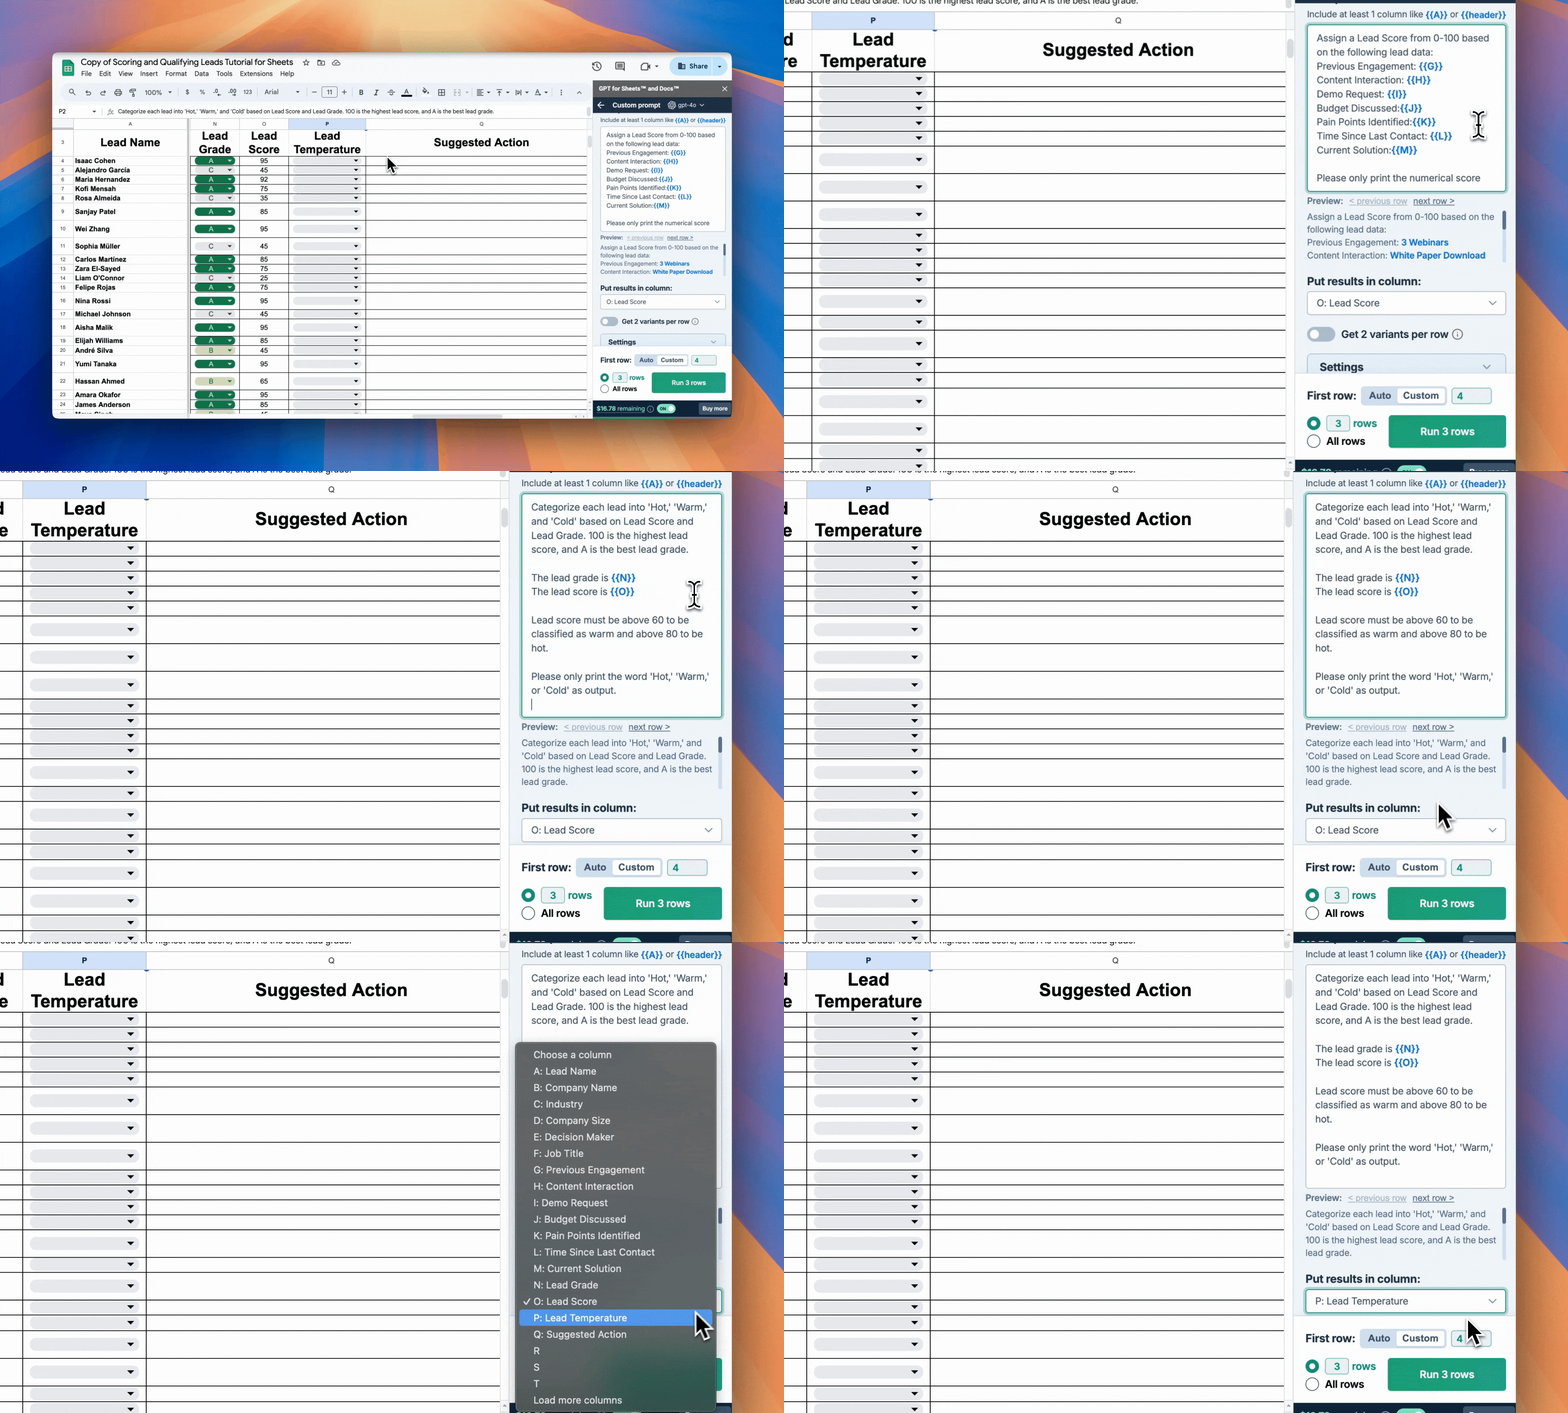
Test the prompt on the first three rows. If satisfactory, run the bulk tool on all rows.
Generate suggested actions
Finally, copy and paste the following prompt to generate a suggested action your sales team can take for each lead:
Based on the following lead data, generate a unique Suggested Action to take with the lead.

Lead Data:
Company Name:{{B}}
Industry: {{C}}
Company Size: {{D}}
Decision Maker: {{E}}
Job Title: {{F}}
Previous Engagement: {{G}}
Content Interaction: {{H}}
Demo Request: {{I}}
Budget Discussed: {{J}}
Pain Points Identified: {{K}}
Time Since Last Contact: {{L}}
Current Solution: {{M}}
Lead Score: {{N}}
Lead Grade: {{O}}
Lead Temperature: {{P}}

Please print the suggested action as a single sentence.
Select the column where you want the results to appear (column Q).
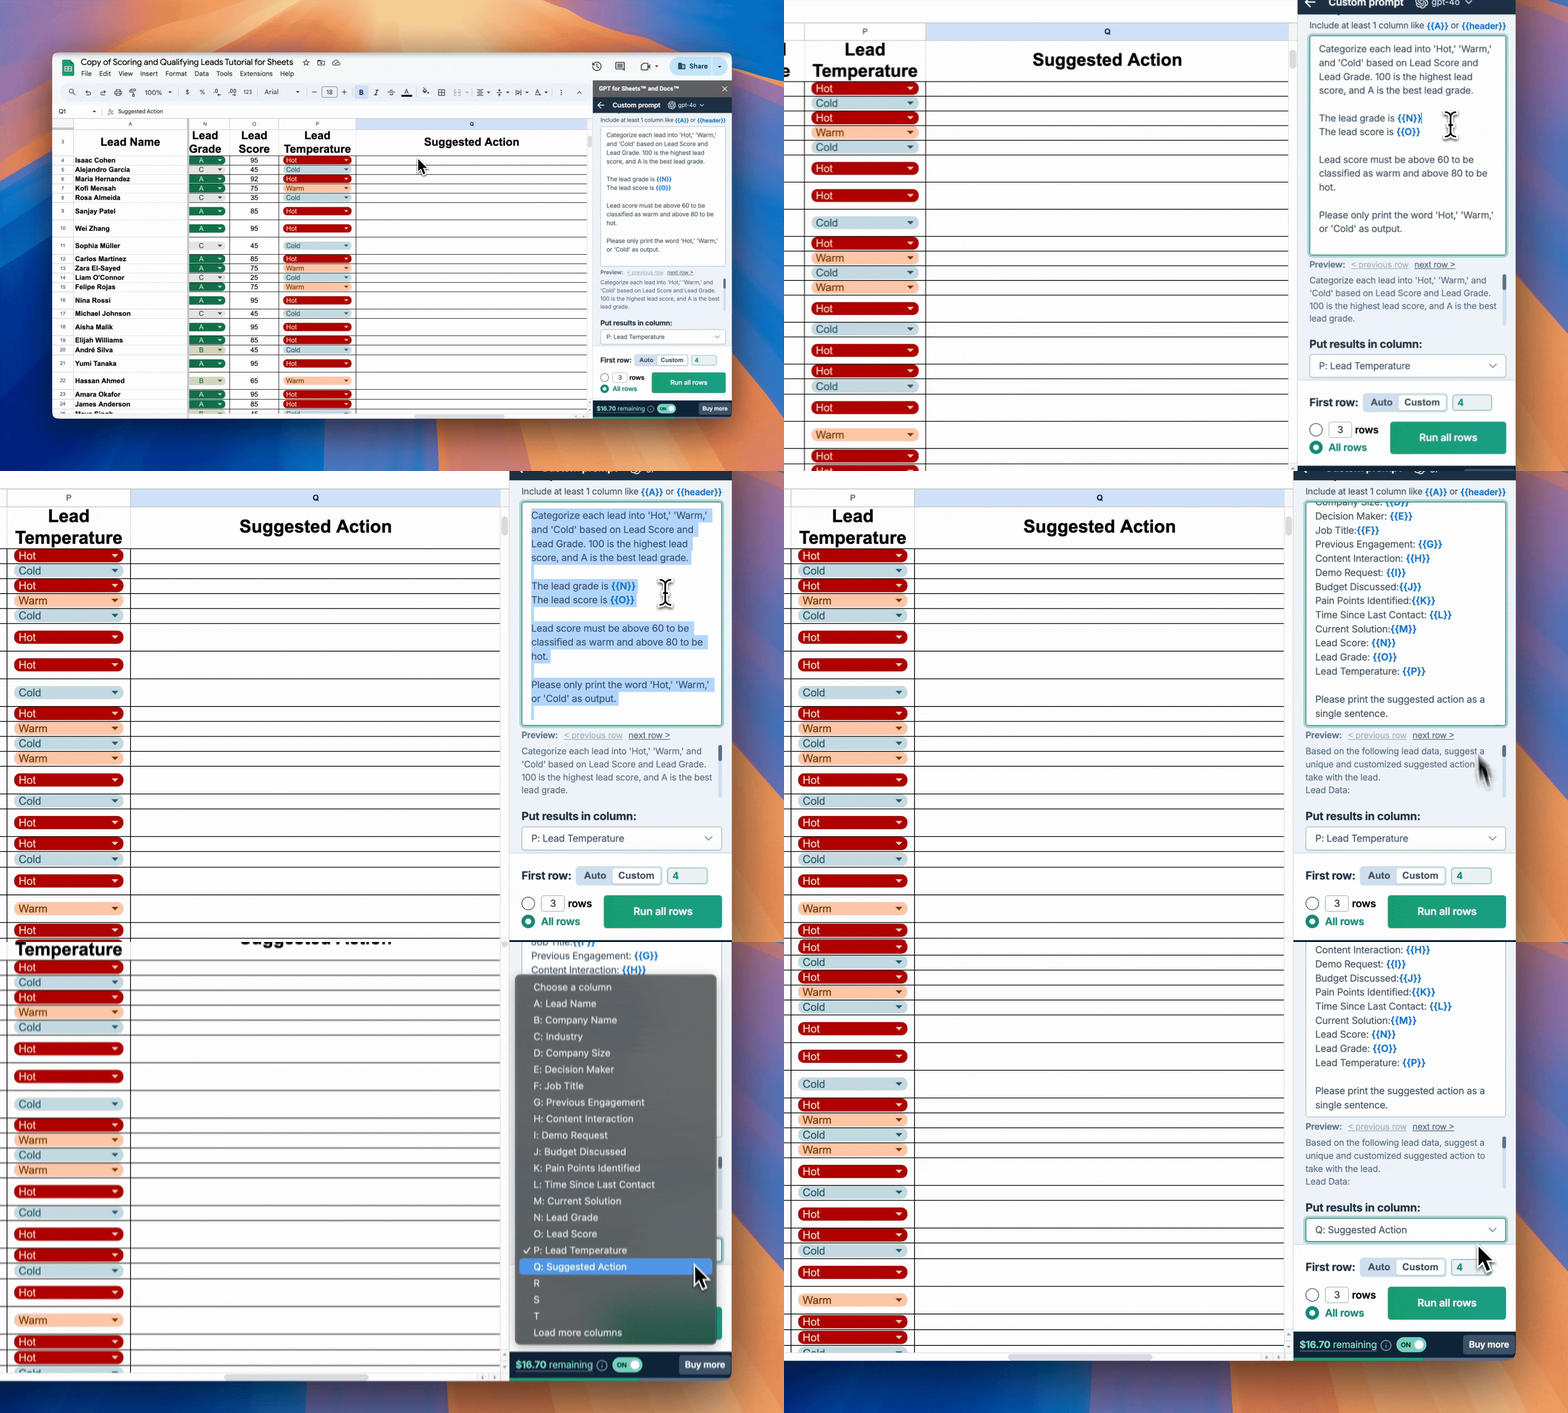
Test the prompt on the first three rows. If satisfactory, run the bulk tool on all rows.
Reviewing the results
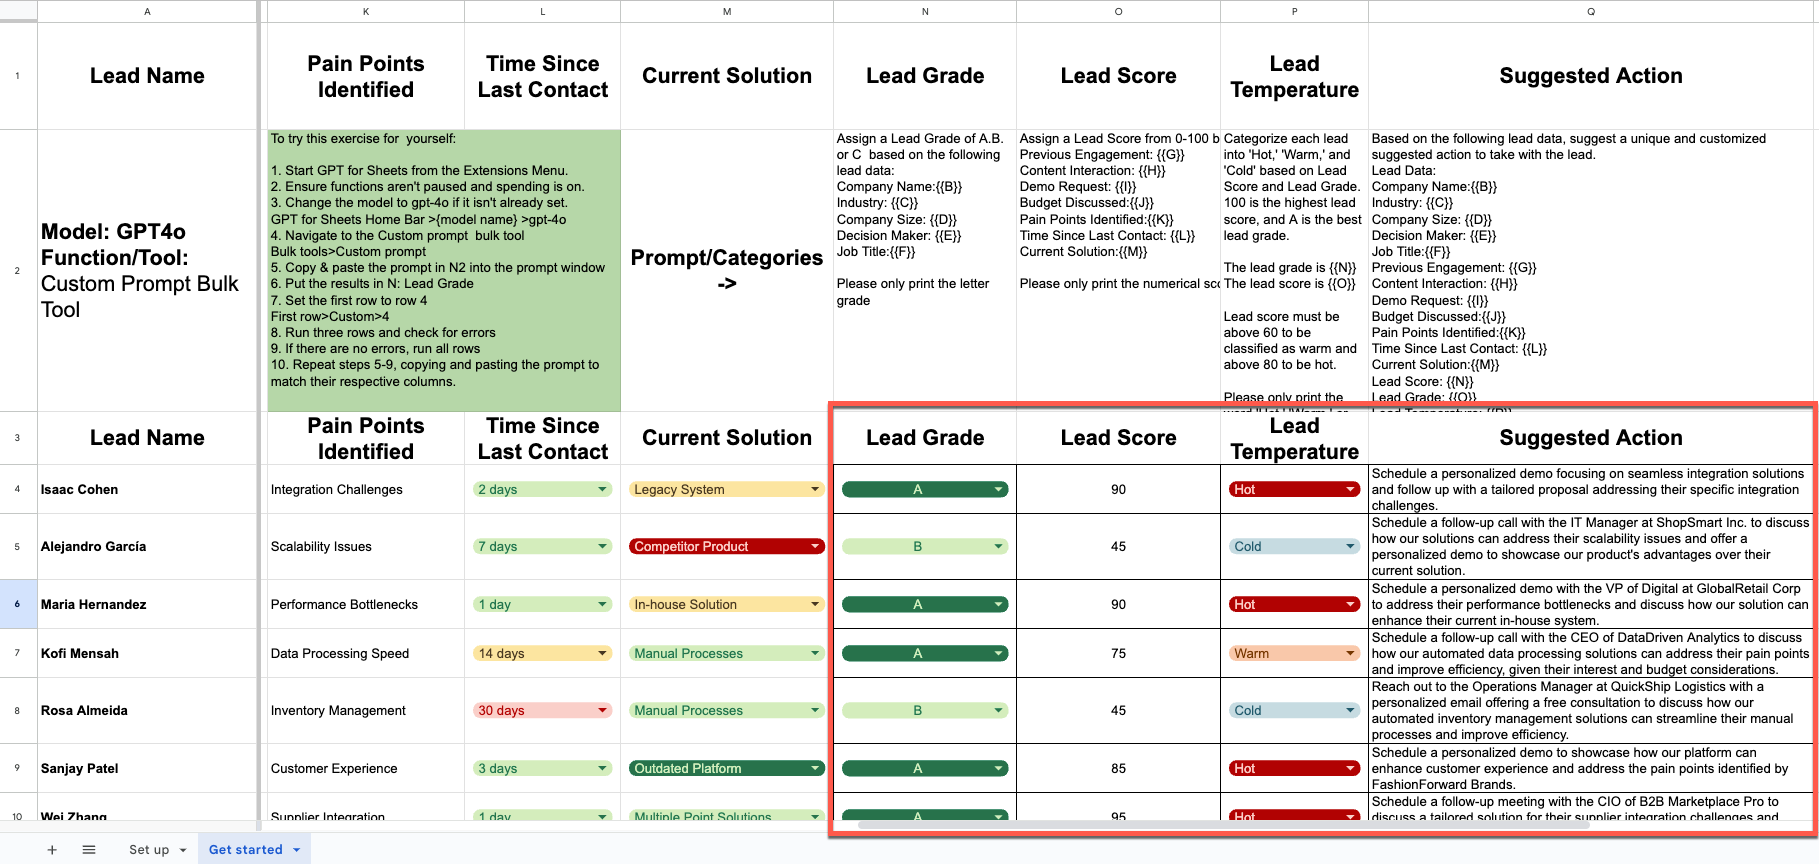
After running these prompts, you'll have a complete overview of each lead:
- Lead Grade (Column N): Shows how well the lead fits your ideal customer profile.
- Lead Score (Column O): Indicates the lead's level of engagement and interest.
- Lead Temperature (Column P): Categorizes the lead's readiness to decide.
- Suggested Action (Column Q): Provides a tailored next step for each lead.
Use this information to prioritize your sales efforts, tailor your communication, and optimize your marketing strategies.
Improving your results (optional)
You can further improve your lead management results by integrating the following processes into your workflow:
Utilize Additional Variables: Your spreadsheet may contain more specific behavioral and demographic data on your leads, which you can use to qualify them more accurately. Simply target the associated columns and specify the datatype inside your prompt like so:
Assign a Lead Grade of A, B, or C based on the following lead data:

Company Name: {{B}}
Industry: {{C}}
Company Size: {{D}}
Decision Maker: {{E}}
Job Title: {{F}}
Budget: {{Q}}

Please only print the letter grade.
Adding and Adjusting Custom Instructions or Categories: In the tutorial, we asked gpt-4o to evaluate leads automatically based on lead data.
However, you can add or adjust custom instructions and additional categories if you want the Custom prompt bulk tool to sort data as we did with the Hot, Warm, and Cold categories while qualifying leads.
Using this technique, you can improve your results by inserting specific criteria into your prompt to qualify leads based on your business’s needs.
For example, if you wanted your sales team to pursue C suite leads proactively, you could add the following to the qualifying prompt:
Categorize each lead into 'Hot,' 'Warm,' and 'Cold' based on Lead Score and Lead Grade.

Apply the following rules in order: 1. If the job title is a C suite or executive, categorize the lead as 'Hot' regardless of score or grade. 2. For all other job titles:

100 is the highest lead score, and A is the best lead grade.

The lead grade is {{N}}
The lead score is {{O}}
Lead score must be above 60 to be classified as warm and above 80 to be hot.

The job title is {{F}}


Please only print the word 'Hot,' 'Warm,' or 'Cold' as output.
Alternatively, if you have existing workflows for lead follow-ups, you could adjust the suggested action prompt to include them:
Based on the following lead data, suggest a unique and customized suggested action to take with the lead.

Lead Data:
Company Name: {{B}}
Industry: {{C}}
Company Size: {{D}}
Decision Maker: {{E}}
Job Title: {{F}}
Previous Engagement: {{G}}
Content Interaction: {{H}}
Demo Request: {{I}}
Budget Discussed: {{J}}
Pain Points Identified: {{K}}
Time Since Last Contact: {{L}}
Current Solution: {{M}}
Lead Score: {{N}}
Lead Grade: {{O}}
Lead Temperature: {{P}}

Example Actions:
For Hot Leads:
Schedule a Sales Call or Meeting:
Prioritize setting up a call or meeting to capitalize on their recent interest.
Send a Personalized Proposal:
Create and send a tailored proposal that directly addresses their needs and positions your solution as the best fit.
Offer a Free Consultation:
Offer a consultation to provide personalized insights and further build the relationship.
For Warm Leads:
Offer a Product Demo:
Reach out with an invitation to a product demo to reignite their interest and move them closer to a decision.
Send a Follow-Up Email with Additional Resources:
Send an email with targeted resources (e.g., white papers, case studies) to nurture their interest.
Invite to an Industry-Specific Webinar:
Send an invitation to an upcoming webinar that addresses challenges specific to their industry.
For Cold Leads:
Place in a Long-Term Nurturing Campaign:
Add them to a long-term nurturing sequence that periodically sends relevant content to keep your brand top-of-mind.
Send a Re-engagement Campaign:
Attempt to re-engage them with a special offer, a new case study, or a webinar invitation.
Request Feedback or Conduct a Survey:
Reach out to request feedback or invite them to participate in a survey, which can help gather insights and potentially re-engage them.

Please print the suggested action as a single sentence.
Improve Coherence: If you insert custom rules into your prompts, you can adjust the creativity level of the model to 0 through the settings menu in the Custom prompt bulk tool to strictly follow your prompt.
Our GPT for Sheets and GPT for Excel documentation provide further information on best practices for custom prompting.
Estimated token use
All costs have been estimated using gpt-4o in Sheets or Excel. You can read more about model pricing here and view our cost estimator here.
Estimated token cost to evaluate one lead
Category | Tokens | Cost |
|---|---|---|
Function | 12 | $0.00024 |
Prompt | ~65.67 | ~$0.0013 |
Value | ~143.75 | ~$0.0029 |
Output | ~1.66 | ~$0.0000332 |
Total | ~223.08 | ~$0.00446 |
Note: The estimate is based on an average from grading, scoring, and qualifying the leads from the tutorial using gpt-4o in GPT for Sheets. Actual token use and costs will vary based on model, prompt, and lead data.
Estimated token cost by number of generations
Generations | Tokens | Cost |
|---|---|---|
1 | ~223 | ~$0.0045 |
40 | ~8,923 | ~$0.18 |
100 | ~22,308 | ~$0.45 |
1,000 | ~223,000 | ~$4.46 |
10,000 | ~2,230,800 | ~$44.60 |
If you have high enough rate limits, using your API key can reduce costs. Learn more about our pricing.
Conclusion
You should now understand how the Custom prompt bulk tool in GPT for Excel and Sheets can help you efficiently manage your B2B leads through scoring, grading, and qualifying. This automation can significantly improve your sales team's efficiency, allowing them to focus on the most promising opportunities and tailor their approach based on comprehensive lead analysis.
We would love to hear if you enjoyed this guide or have suggestions for the next one. If you want to try this exercise yourself, use either of the following tutorial files:
Remember to check out our other guides, documentation for GPT for Sheets, GPT for Excel, and the rest of our GPT for Work products.
