Use GPT for Sheets or Excel's Classify / Categorize bulk tool to automatically categorize and analyze customer feedback, extract valuable insights, and drive continuous improvement in your e-commerce business. This approach lets you quickly process large volumes of support tickets, chat logs, product reviews, and more to identify trends and determine actions to enhance your products and services in a way traditional customer support tools cannot.
This guide will walk you through analyzing customer feedback using GPT for Sheets or Excel. While you can also use specific functions like GPT_CLASSIFY, this guide will use the Classify bulk tool.
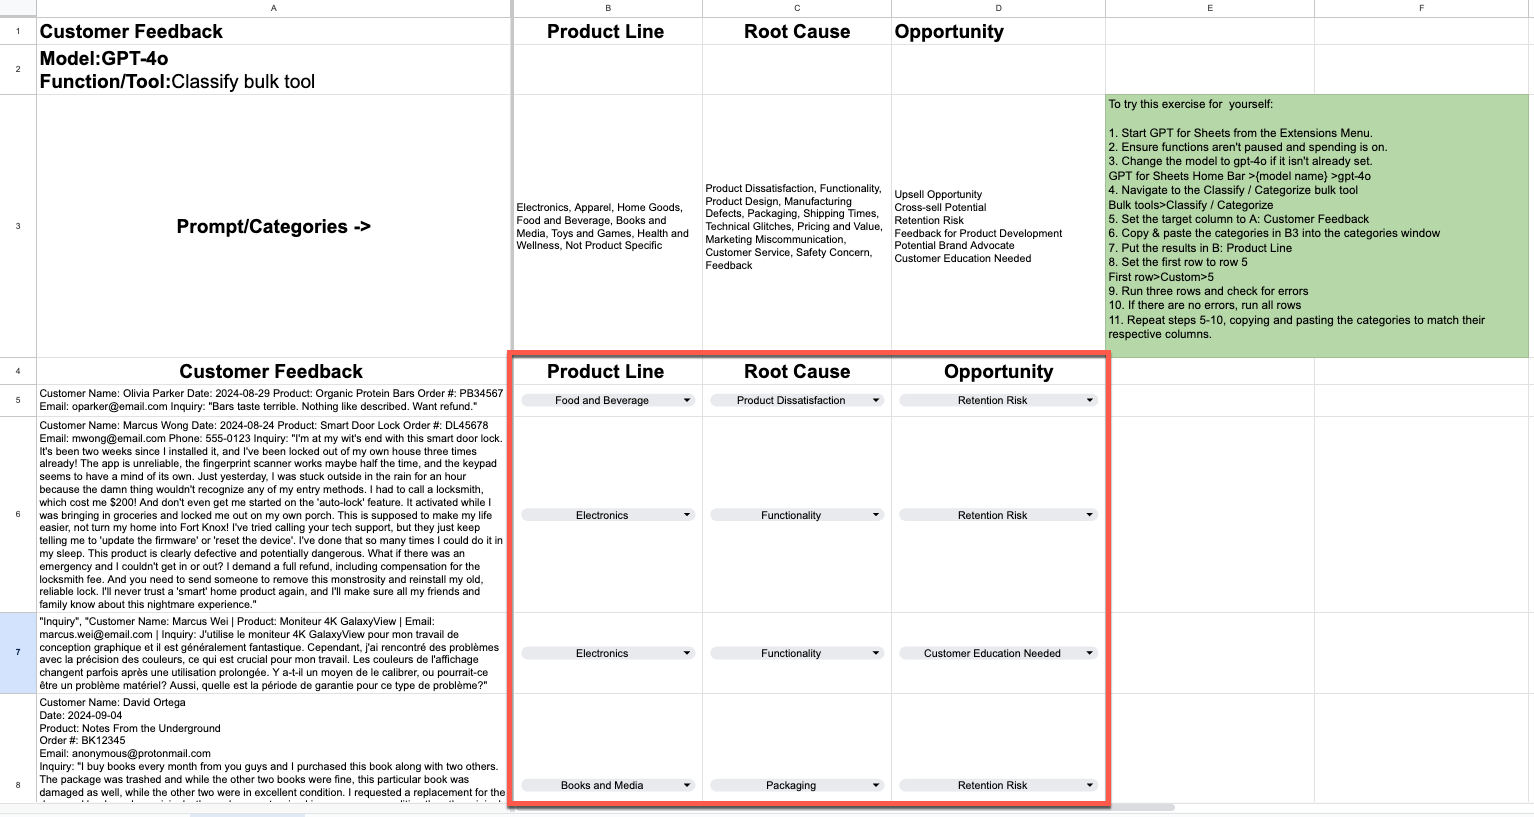
By the end of this guide, you will know:
- How GPT for Sheets or Excel can help categorize and analyze e-commerce customer feedback.
- Advantages of using spreadsheets for feedback analysis.
- How to use the
Classifybulk tool in GPT for Sheets or Excel. - How to set up a customizable feedback analysis system using GPT for Excel or Sheets.
Why use GPT for Sheets or Excel for e-commerce feedback analysis?
Analyzing e-commerce feedback or support tickets in spreadsheets using GPT for Sheets or Excel offers several unique advantages:
- Flexible categorization: Unlike fixed categories in helpdesk systems, you can create and modify as many categorizations as you want on the fly, adapting to new insights or changing business needs.
- Custom extraction: Identify and extract specific words or content like product references or competitor mentions
- Cross-lingual analysis: Analyze customer feedback regardless of language or translate it to your work language.
Leverage your spreadsheet: Combine your analysis with built-in visualization and pivot table features.
Processing customer feedback with the Classify / Categorize bulk tool
Prerequisites
To begin this tutorial, you need to complete the following prerequisites:
- Install GPT for Sheets or GPT for Excel
- Copy the appropriate template:
- For Google Sheets, click USE TEMPLATE: Categorize Customer Feedback For Sheets Tutorial with gptforwork.com
- For Microsoft Excel, click File > Download the .xlsx file in your computer, and open the .xlsx file in Microsoft Excel: Categorize Customer Feedback For Excel Tutorial with gptforwork.com
- Or you have opened a spreadsheet containing customer support tickets in at least one column.
Getting started in GPT for Sheets
Open GPT for Sheets using the Extensions menu at the top of your document.
Note: You can also complete this tutorial in Excel. While the Excel version has been slightly modified due to formatting limitations between Sheets and Excel, the differences are purely cosmetic and do not affect the content or functionality of the tutorial. Other differences between the tutorials are noted below.
Selecting a model
In the GPT for Sheets sidebar, check that the model is set to gpt-4o. If not, open the model switcher dropdown and select gpt-4o.
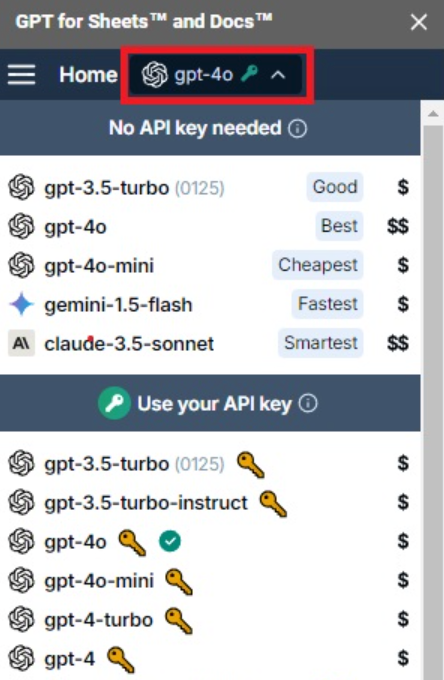
We recommend using gpt-4o to complete this tutorial because it balances cost and accuracy well.
You can try gpt-4o-mini to take advantage of substantial cost savings. However, to achieve similar accuracy to gpt-4o, gpt-4o-mini requires more precise and longer custom instructions.
Feel free to try out some different models and compare your results!
Classify customer feedback by product line
First, we will sort our content by product line using the Classify bulk tool.
Note: If you are using your own file or need help getting started, refer to our Classify bulk tool guides for GPT for Sheets and GPT for Excel.
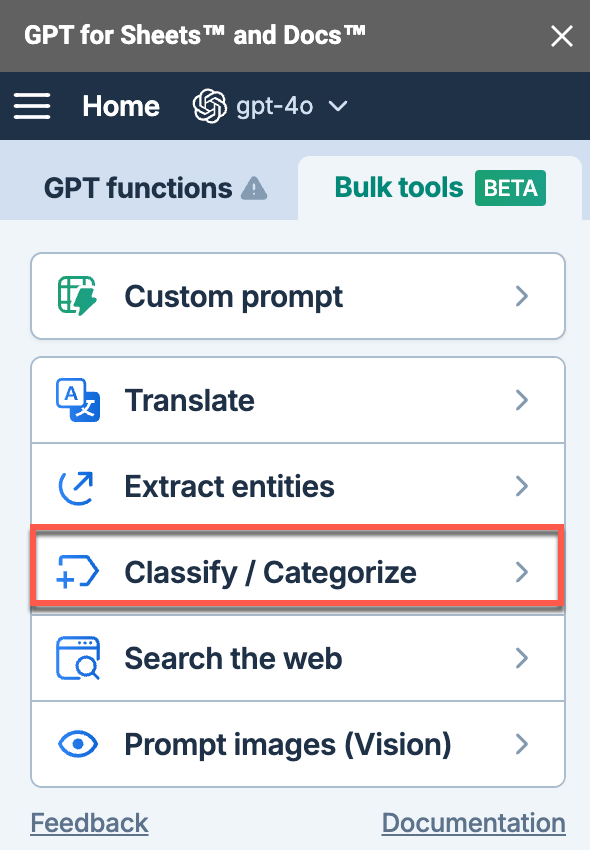
From the Bulk Tools tab, select the Classify bulk tool to configure your classification task.
Select the column containing the customer feedback to classify and paste the following list of categories (also found in cell B3).
Electronics,
Apparel,
Home Goods,
Food and Beverage,
Books and Media,
Toys and Games,
Health and Wellness,
Not Product Specific
Select the column where you would like the results to appear (column B).
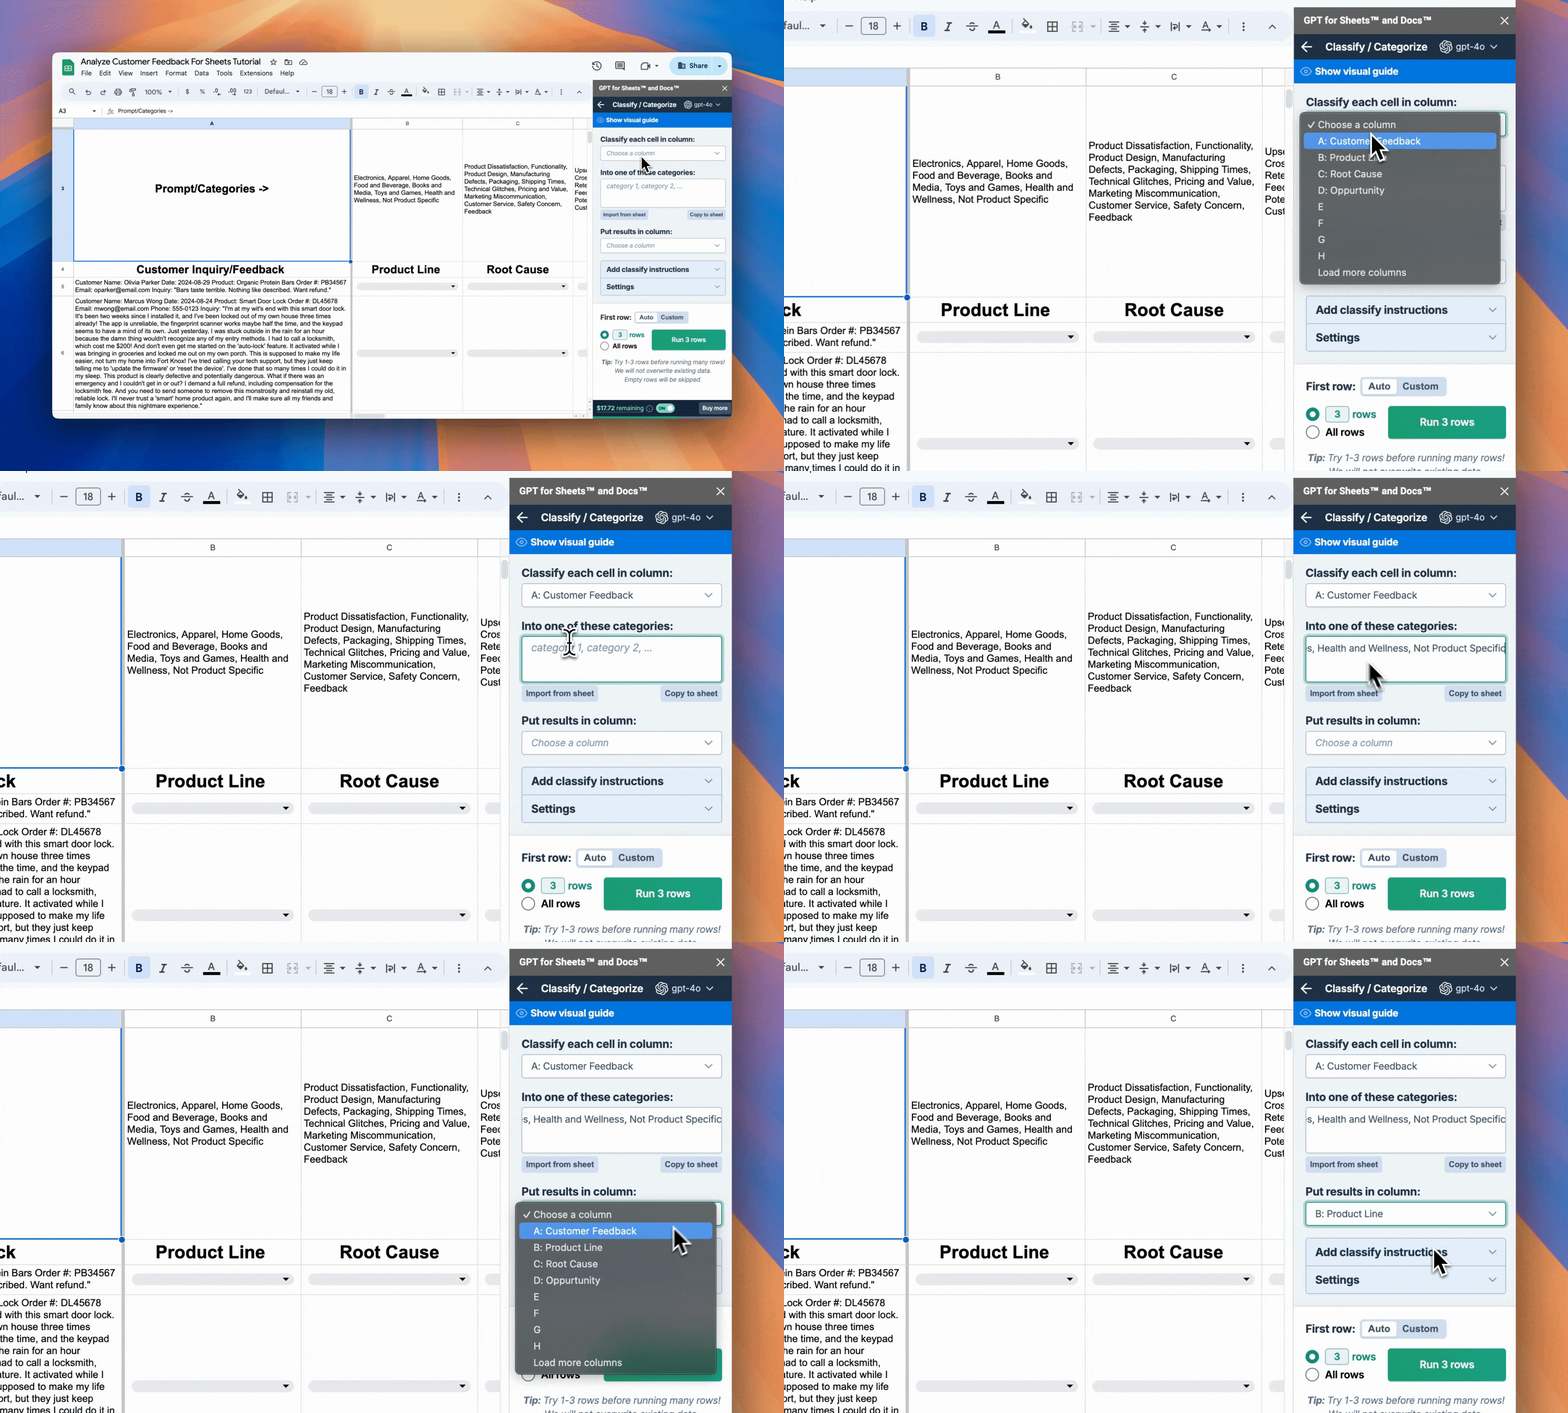
Set the first row to 5. Then, run the first three rows to test the classification and check the result (it will run the following three empty rows starting from row 5).
If satisfactory, run all rows to classify all feedback.
Determine root cause
Next, we will analyze the customer feedback to identify the root cause of each comment.
Paste the following list of categories (also found in cell C3).
Product Dissatisfaction,
Functionality,
Product Design,
Manufacturing Defects,
Packaging,
Shipping Times,
Technical Glitches,
Pricing and Value,
Marketing Miscommunication,
Customer Service,
Safety Concern,
Feedback
Select the column where you would like your results to appear (column C).
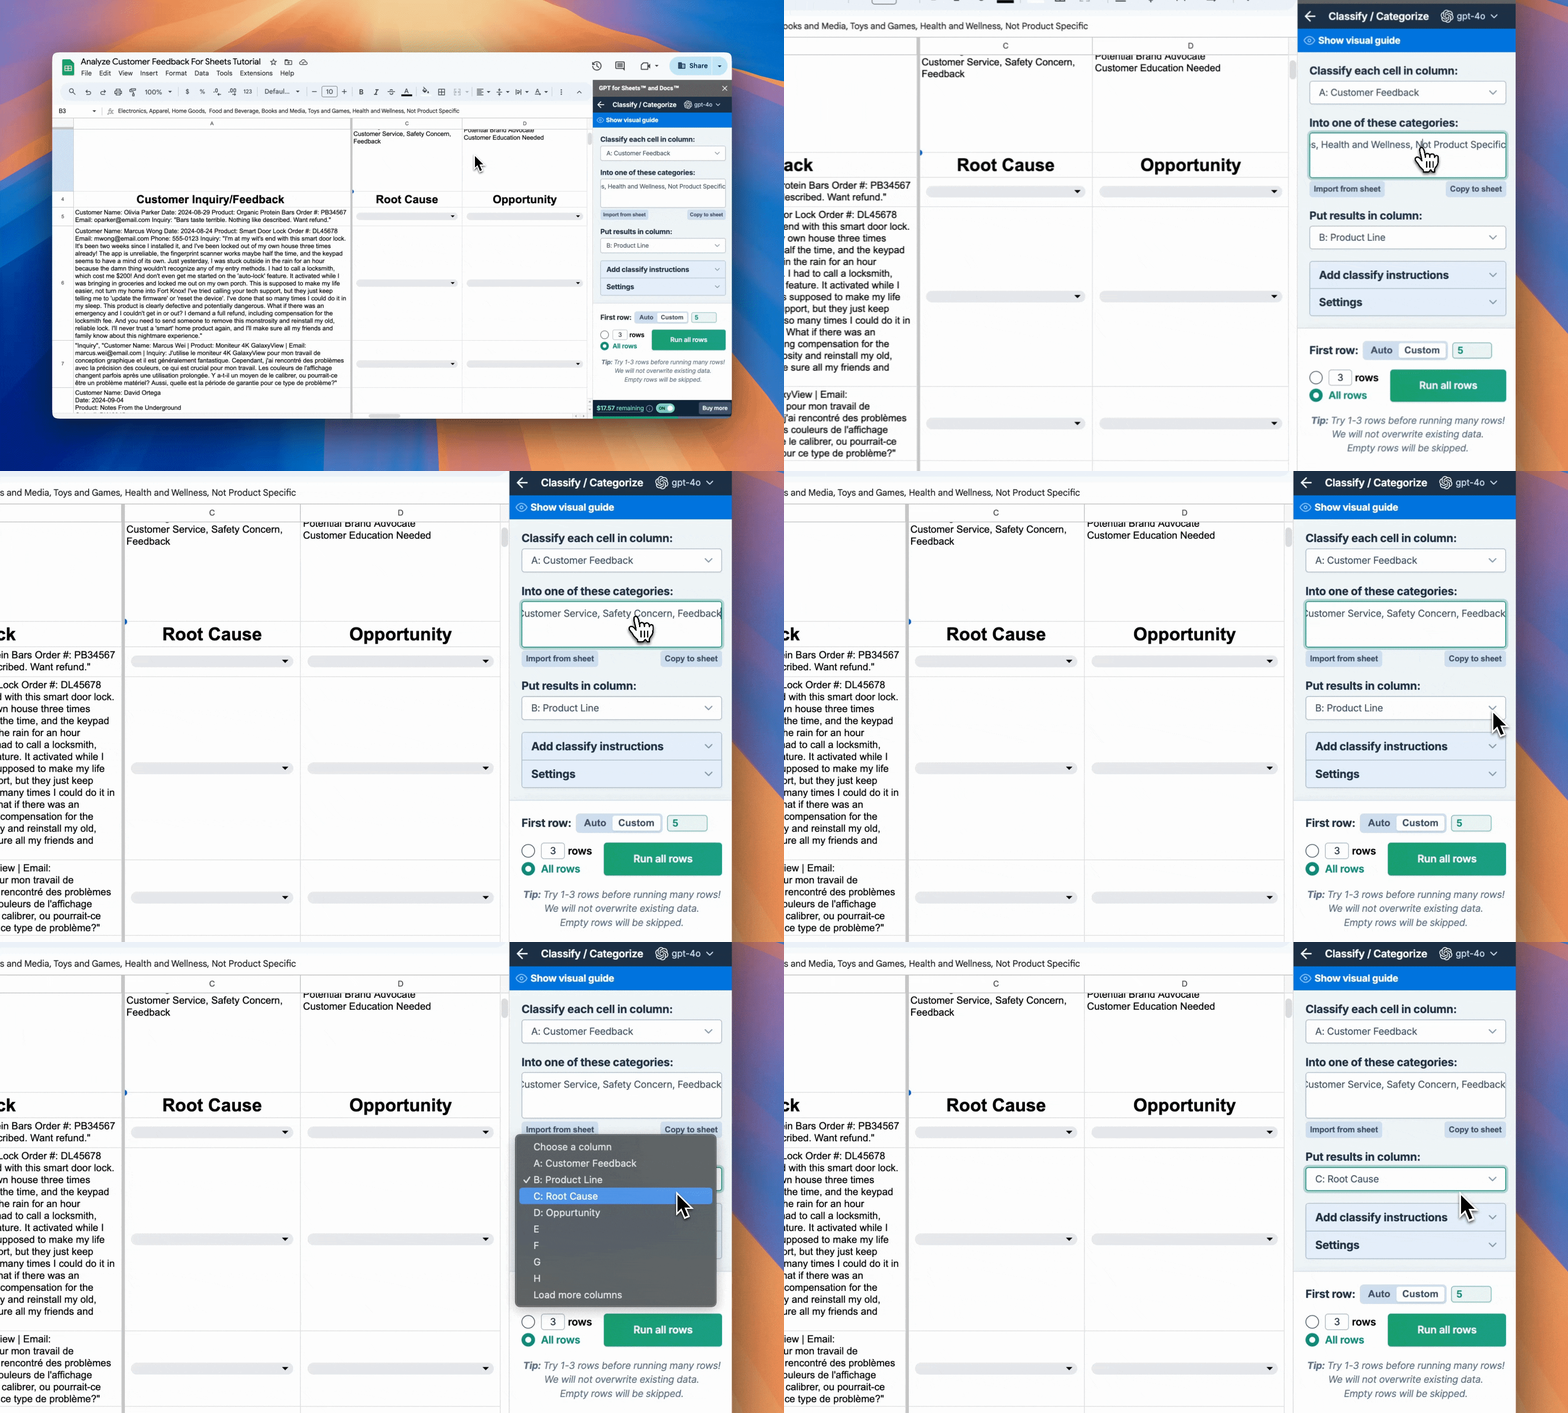
Run 3 rows to test, then run all rows if the results are satisfactory.

Identify opportunities
The last thing we will do is identify a potential opportunity we can take with each customer.
Paste the following list of categories (also found in cell D3).
Upsell Opportunity
Cross-sell Potential
Retention Risk
Feedback for Product Development
Potential Brand Advocate
Customer Education Needed
Select the column where you would like your results to appear (column D).
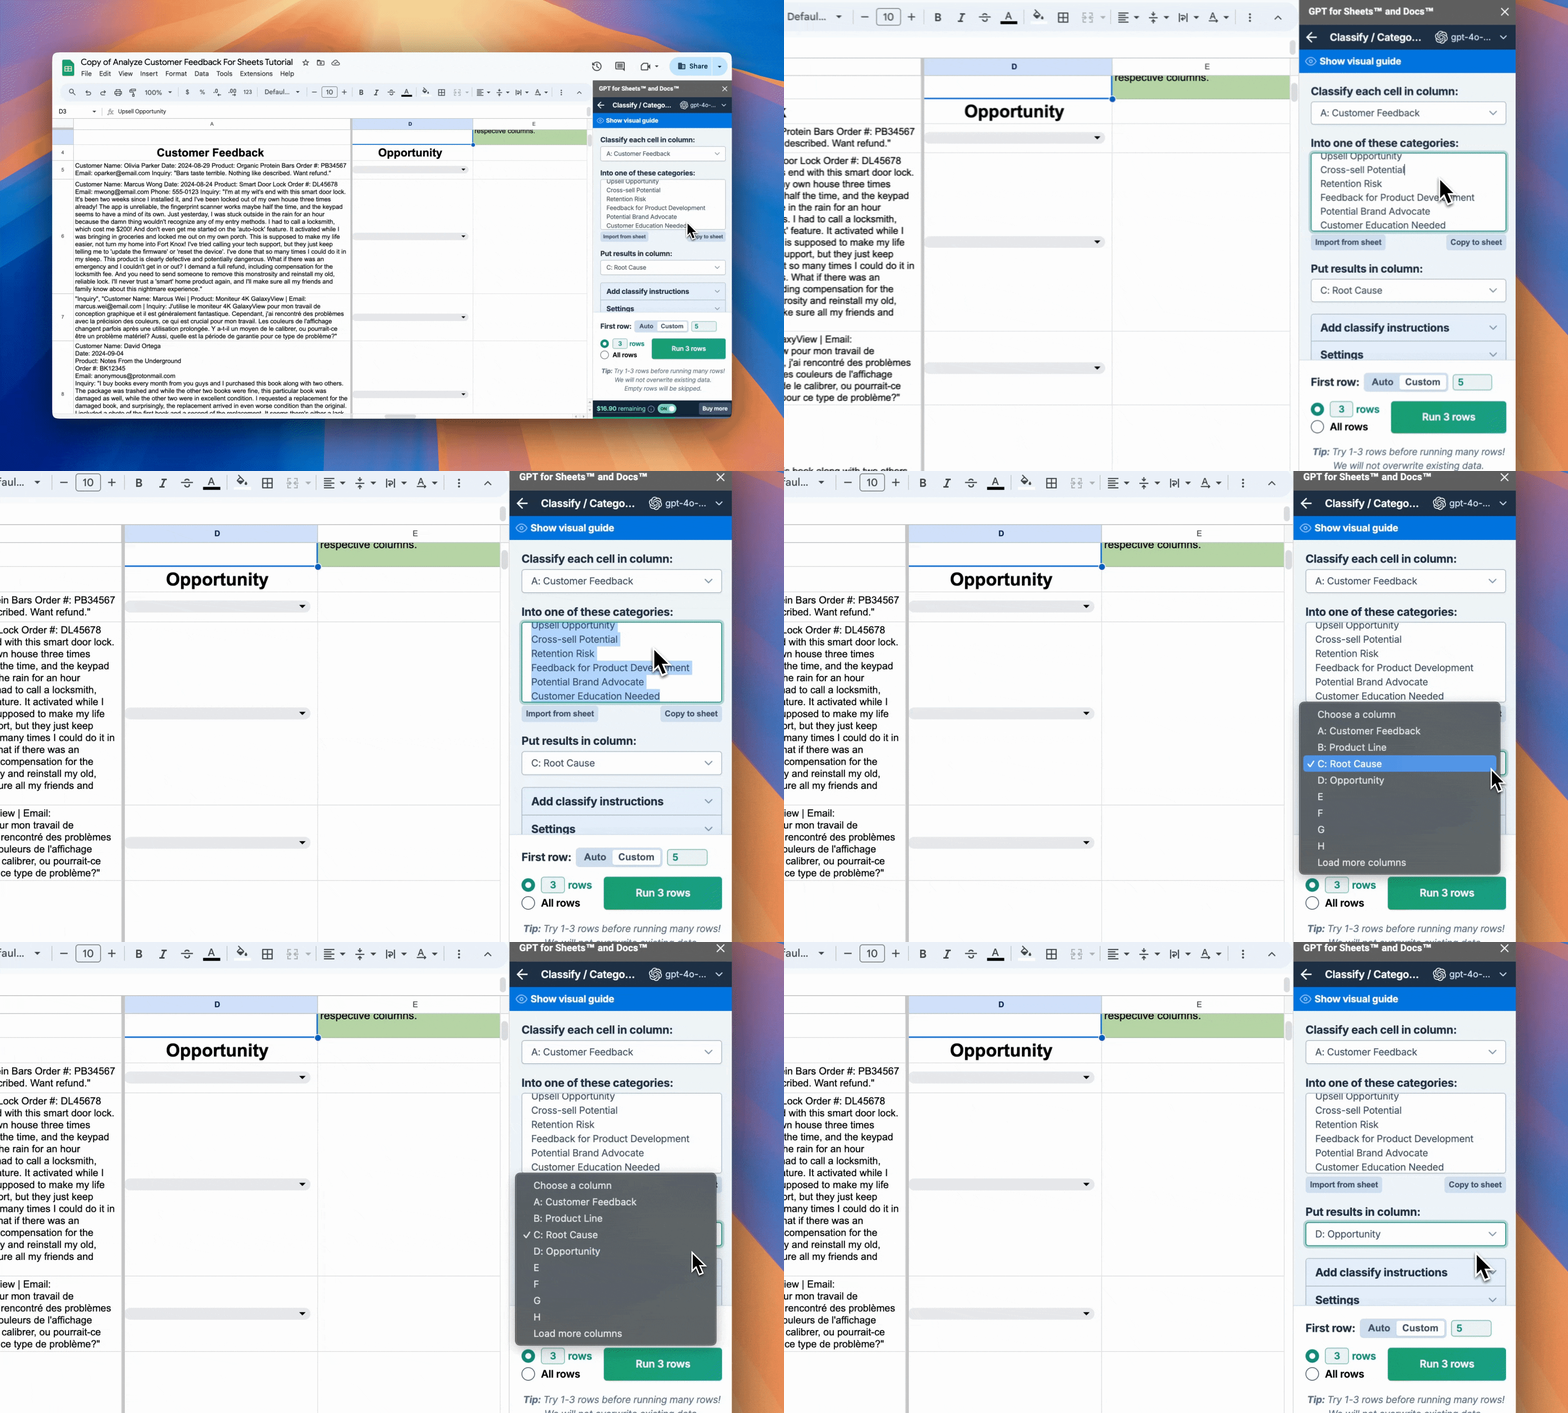
Run 3 rows to test, then run all rows if the results are satisfactory.
Reviewing the results
After running these prompts, you'll have a complete overview of each lead:
- Product Line (Column B): Identifies the product line a customer comment belongs to.
- Root Cause (Column C): Indicates the ‘root cause’ of why a customer made contact.
- Opportunity (Column D): Identifies a specific opportunity you can take with the customer.
While this is only a starting point, you can use this information to run further analyzes and generate insights for your business.
Improving your results (optional)
You can further improve your classification results by integrating the following processes into your workflow:
Refine categories: Regularly review and update your categories to ensure they’re suitable for the customer feedback you’re receiving. Add or remove categories based on your needs.
Multidimensional analysis: Run multiple analyzes to generate more in-depth insights from your content.
Leverage spreadsheet features: Use pivot tables or charts to visualize trends in your classified content.
Use the Custom prompt bulk tool: While the Classify bulk tool is excellent for this task, you can try using the Custom prompt tool to create a more refined prompt based on your spreadsheet’s content. You can see an example of this in our Classifying Leads tutorial.
You can learn more about best practices for classification through our GPT for Sheets and GPT for Excel documentation.
Estimated token use
All costs have been estimated using gpt-4o in Sheets. You can read more about model pricing here and view our cost estimator here.
Estimated token cost to categorize one customer comment
Category | Tokens | Cost |
|---|---|---|
Function | 27 | $0.00054 |
Prompt | ~112.38 | ~$0.002248 |
Value | ~30.33 | ~0.00061 |
Output | ~3.39 | ~$0.000068 |
Total | ~173.09 | ~$0.00346 |
Note: The estimate is based on an average of the three classifications in the Google Sheets tutorial file. Classification task costs may vary based on model, output, and total number of categories.
Estimated token cost by number of generations
Generations | Tokens | Cost |
|---|---|---|
1 | ~173.09 | ~$0.00346 |
40 | ~6,923.6 | ~$0.138 |
100 | ~17,309 | ~$0.346 |
1,000 | ~173,090 | ~$3.462 |
10,000 | ~1,730,900 | ~$34.62 |
If you have high enough rate limits, using your API key can reduce costs. Learn more about our pricing.
Conclusion
You should now understand how the Classify bulk tool in GPT for Sheets and Excel can automatically help you process customer feedback from a wide variety of sources. This process can transform your historical customer feedback into a goldmine of actionable insights, enabling more informed decisions across your organization.
We would love to hear if you enjoyed this guide or have suggestions for the next one. If you want to try this exercise yourself, use either of the following tutorial files:
- Categorize Customer Feedback For Sheets Tutorial with gptforwork.com
- Categorize Customer Feedback For Excel Tutorial with gptforwork.com
Remember to check out the rest of our guides and documentation for GPT for Sheets, GPT for Excel, and the rest of our GPT for Work products.
