GPT for Excel lets you choose between several AI models from Anthropic, OpenAI, and other providers through custom endpoints. New models come out all the time, so it's hard to know which one fits your task best.
So we built AutosheetBench, the internal benchmark we announced in our SpreadsheetBench deep dive: a set of 187 "atomic" Excel tasks. We ran six models on it that vary in cost, speed, and capability: Anthropic's Claude Opus 5.5, Claude Fable 5.1, and Claude Opus 4.8, and OpenAI's GPT-6 Astra, GPT-6 Luna, and GPT-5.4. Here's how they compare.
Overall results: Opus 5.5 is the most accurate, GPT-6 Luna the best value
The chart below shows each model's overall score. Each model ran at one reasoning effort level (Low, Medium, or High), which sets how much it thinks before acting. We ran each model at the reasoning effort that gave it the best score-to-cost trade-off in earlier runs. The charts show each model's level next to its name.
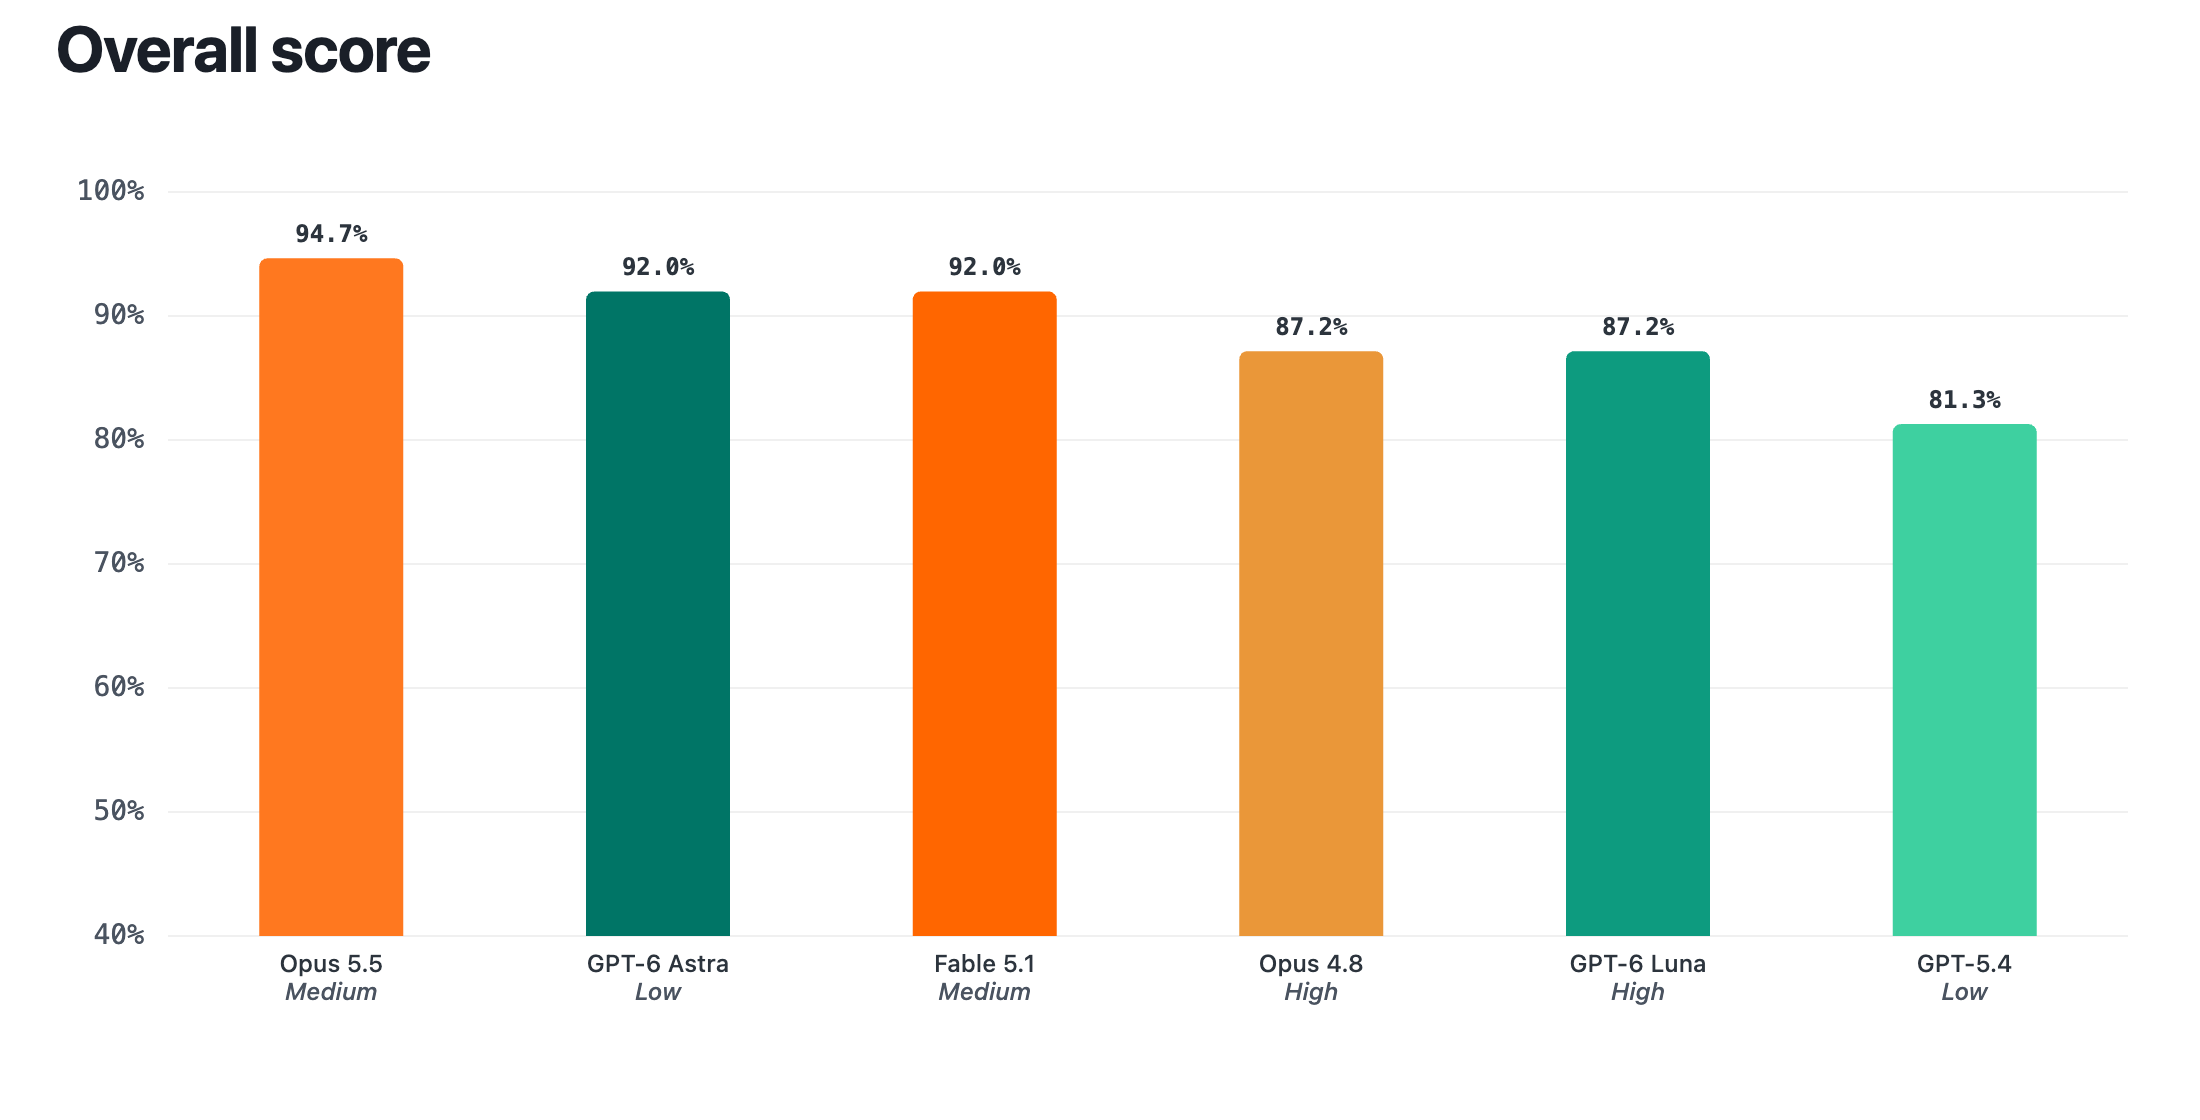
Chart data as a table
Model | Reasoning effort | Score | Tasks failed (of 187) |
|---|---|---|---|
Opus 5.5 | Medium | 94.7% | 10 |
GPT-6 Astra | Low | 92.0% | 15 |
Fable 5.1 | Medium | 92.0% | 15 |
Opus 4.8 | High | 87.2% | 24 |
GPT-6 Luna | High | 87.2% | 24 |
GPT-5.4 | Low | 81.3% | 35 |
Opus 5.5 (Medium) is the best model overall. It passed 94.7% of the 187 tasks and led almost every category. It missed only 10 tasks, and half of those were missed by every model. GPT-6 Astra and Fable 5.1 came next, with 15 misses each.
The next chart plots each model's score against the credits it uses per task, relative to GPT-6 Luna at High reasoning effort. The chart calls this ratio the Credits used index. It counts only the credits used by the agent model, not by the bulk models the agent hands work to, and assumes built-in models on a subscription. The dashed line connects the models with the best trade-off: every model off the line is matched or beaten by a model that uses fewer credits.
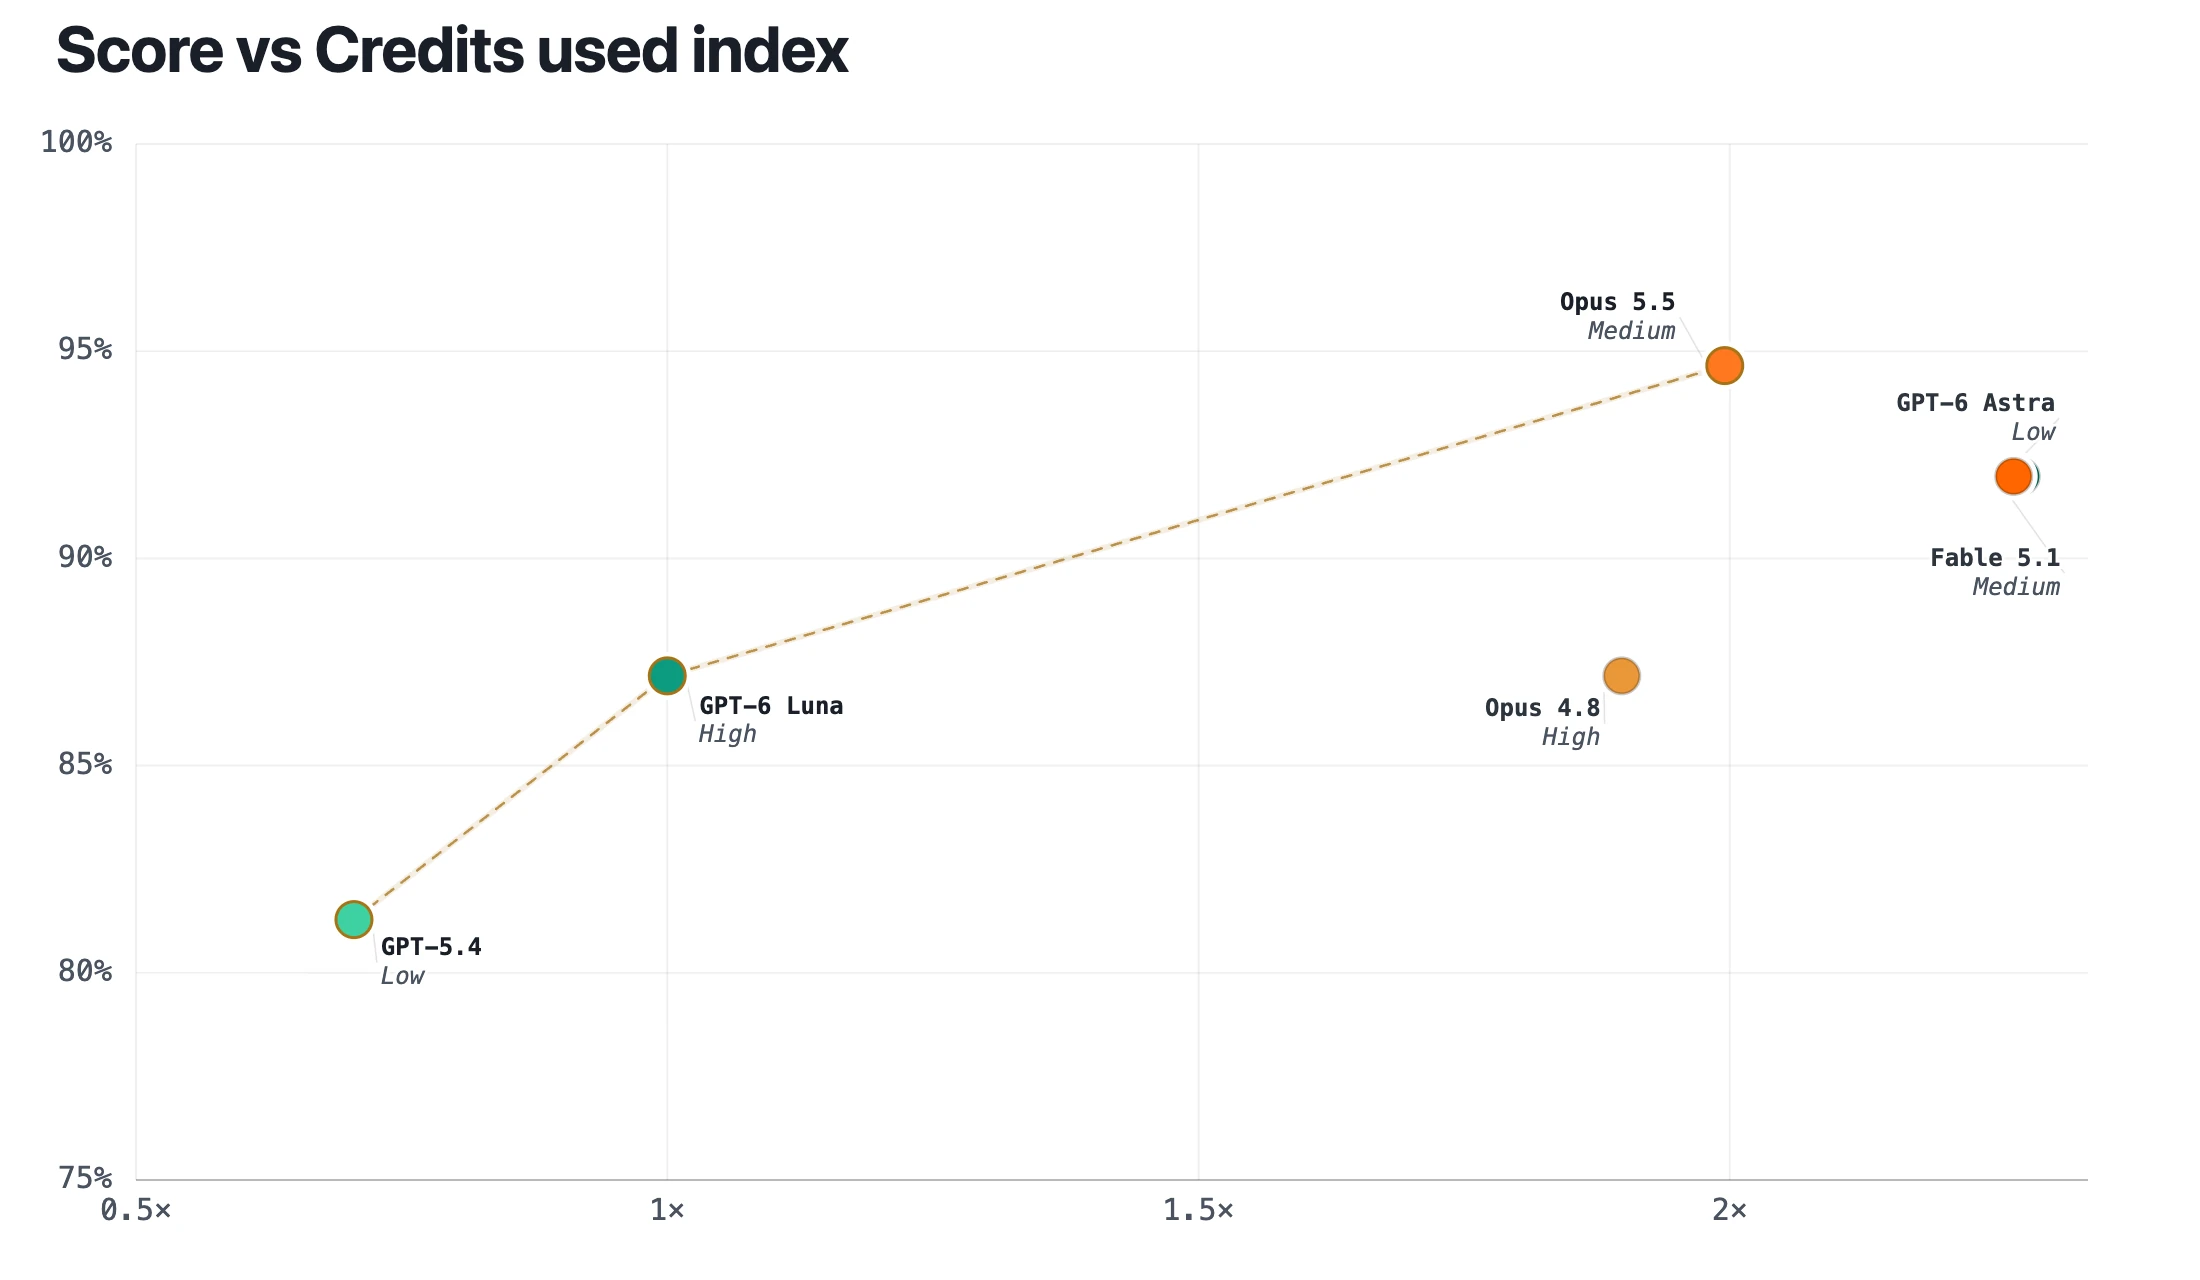
Chart data as a table
Model | Reasoning effort | Score | Credits used index |
|---|---|---|---|
Opus 5.5 | Medium | 94.7% | 2× |
GPT-6 Astra | Low | 92.0% | 2.27× |
Fable 5.1 | Medium | 92.0% | 2.27× |
Opus 4.8 | High | 87.2% | 1.9× |
GPT-6 Luna | High | 87.2% | 1× |
GPT-5.4 | Low | 81.3% | 0.71× |
GPT-6 Luna is the best lower-cost alternative. It scored 87.2%, with 24 misses, while using about half the credits of Opus 5.5. It works best for quick edits and small, direct tasks, and is weaker on visual tasks like charts and formatting, as we'll see below.
GPT-5.4 is the lowest-cost option. It uses about 30% fewer credits than GPT-6 Luna, but scored 81.3%, with 35 misses.
Cost isn't the only trade-off: speed also matters. The chart below compares each model's score with its average duration per task.
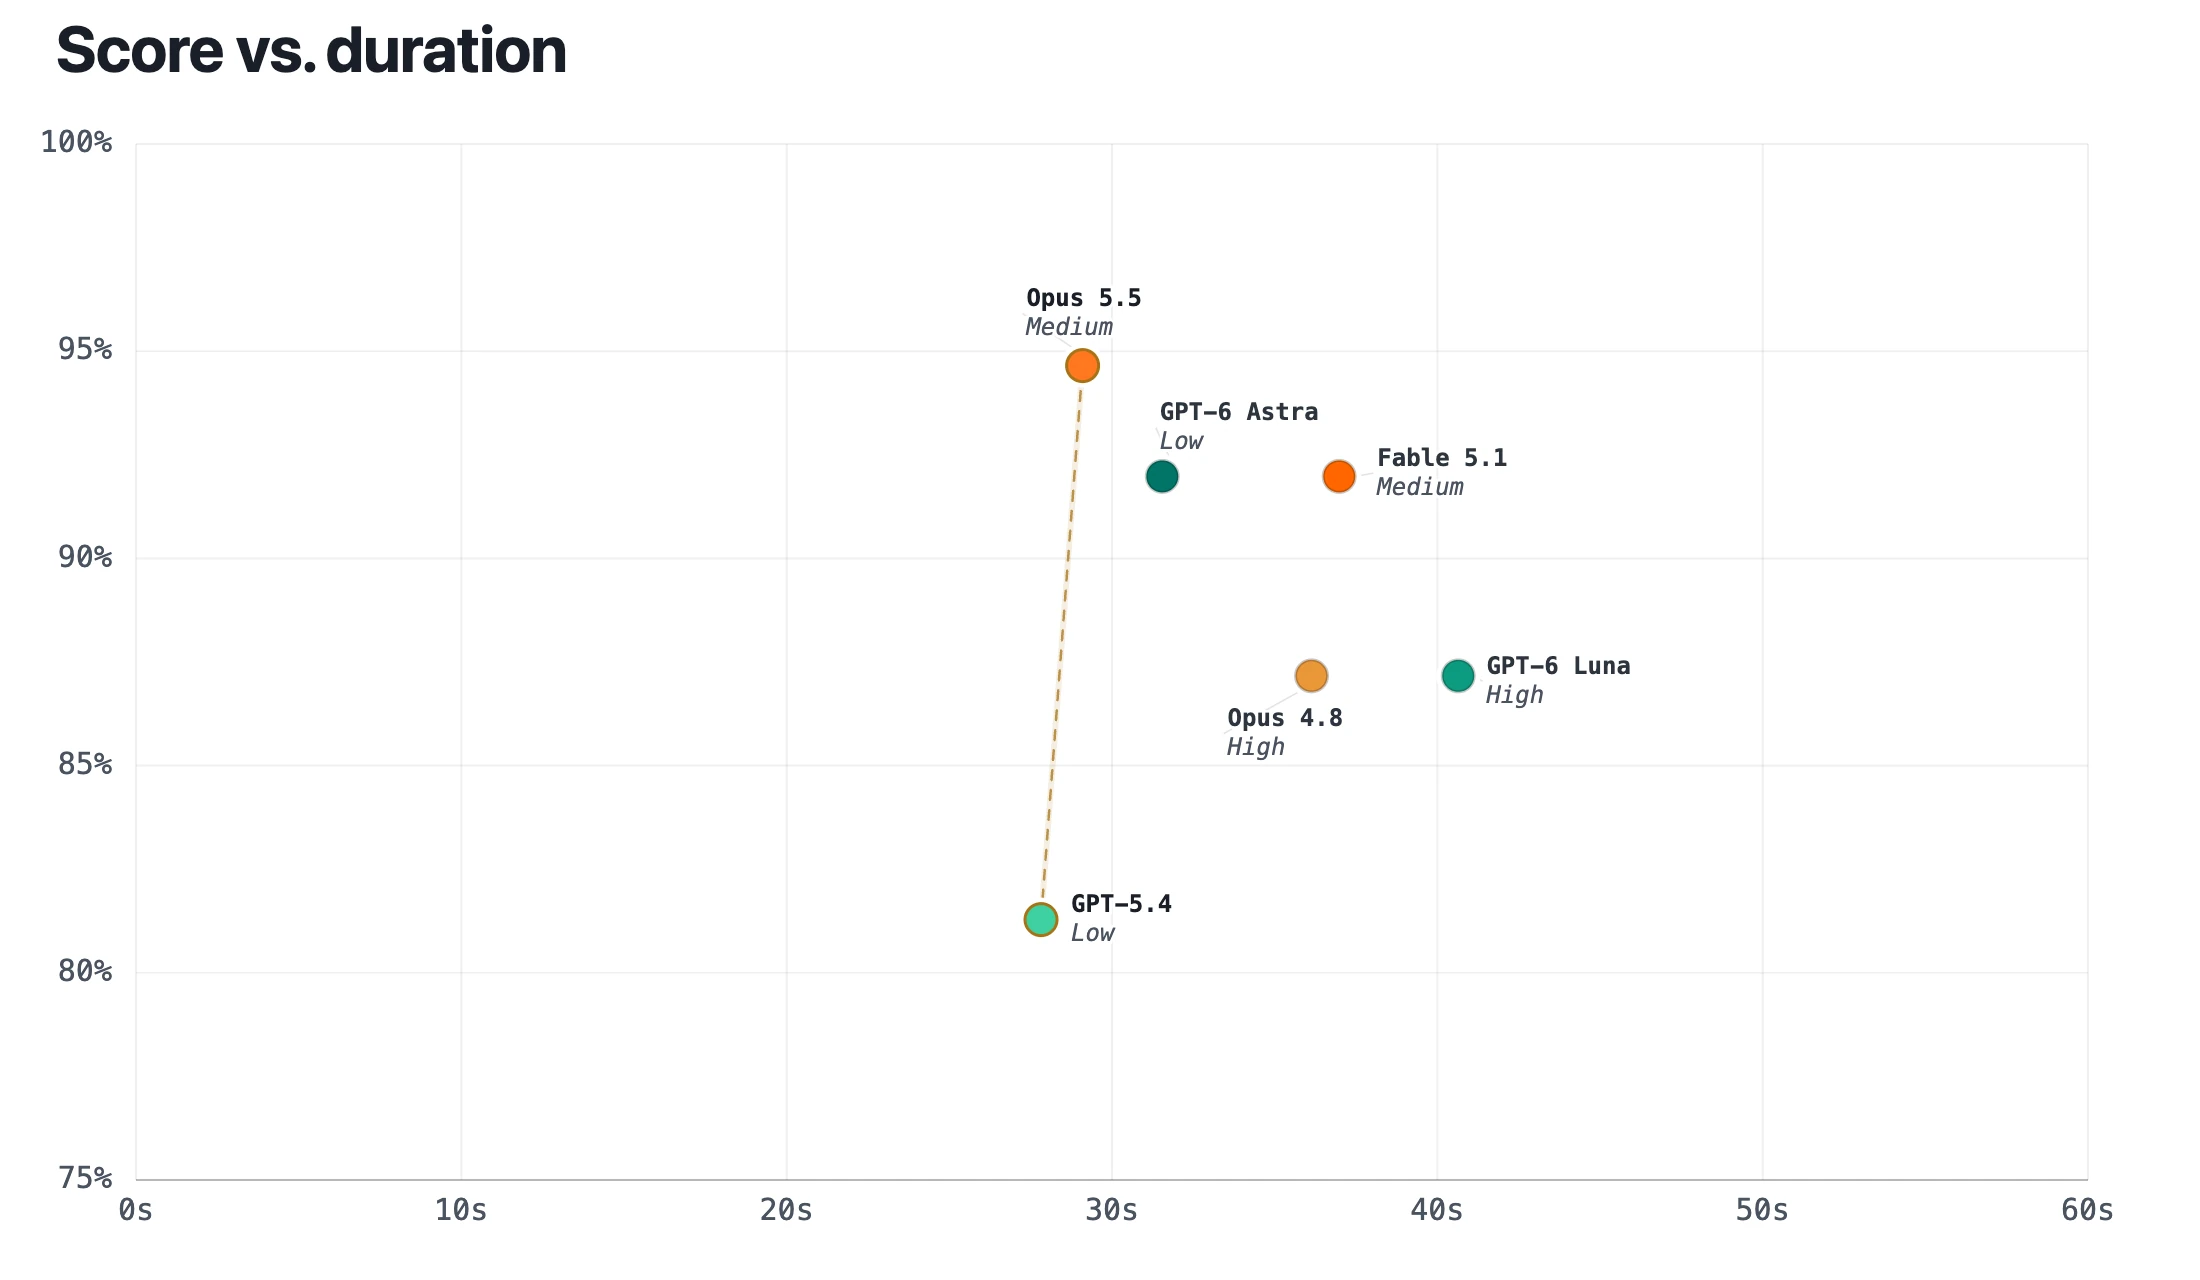
Chart data as a table
Model | Reasoning effort | Score | Average duration per task |
|---|---|---|---|
Opus 5.5 | Medium | 94.7% | 29s |
GPT-6 Astra | Low | 92.0% | 32s |
Fable 5.1 | Medium | 92.0% | 37s |
Opus 4.8 | High | 87.2% | 36s |
GPT-6 Luna | High | 87.2% | 41s |
GPT-5.4 | Low | 81.3% | 28s |
Opus 5.5 combines accuracy with speed. It was one of the fastest models tested, completing a task in about 29 seconds on average. GPT-6 Luna remains cost-effective, but takes longer. It averaged about 41 seconds per task because it tends to iterate more than the other models before finishing.
The latest model releases also cut the errors made by our recommended models dramatically:
- Best model: We now recommend Opus 5.5 instead of Opus 4.8. Errors fell by nearly 60%, from 24 to 10, at a similar cost per task.
- Budget model: Moving from GPT-5.4 to GPT-6 Luna cut errors by about 30%, from 35 to 24, for roughly 40% more credits per task.
Opus 5.5 matches or beats Opus 4.8 in every category, for both native spreadsheet and bulk operations. GPT-6 Luna's gains over GPT-5.4 are mostly on native spreadsheet operations, as we'll see later.
The benchmark: 187 everyday Excel tasks
We ran every model in GPT for Excel on the same workbooks, with the same prompts and the same scoring rules, between September 11 and September 26 as new models were released. For each run, we measured whether the model got the task right, how long it took, and how much it cost. The agent uses different tools in Google Sheets, so results there may differ.
The benchmark covers 187 small, self-contained tasks: inserting a column, writing a formula, creating a line chart, formatting a header, and so on. It leaves out end-to-end work such as building or debugging a financial model, or turning a full analysis into a dashboard. We see it as the first step in a continuous effort to improve our product.
The tasks reflect what our agent handles day to day. We built them from real users' spreadsheets and prompts, and split them into two groups:
- 28 bulk operations apply the same operation to every row of a large dataset, such as translating a value or extracting information from a cell. We used datasets of 1,000 rows and kept the cases simple, with little setup needed beforehand (for example, no glossary to filter before translating).
- 159 native spreadsheet operations are everyday tasks on the spreadsheet itself.
Every model scored lower on bulk operations than on native ones:
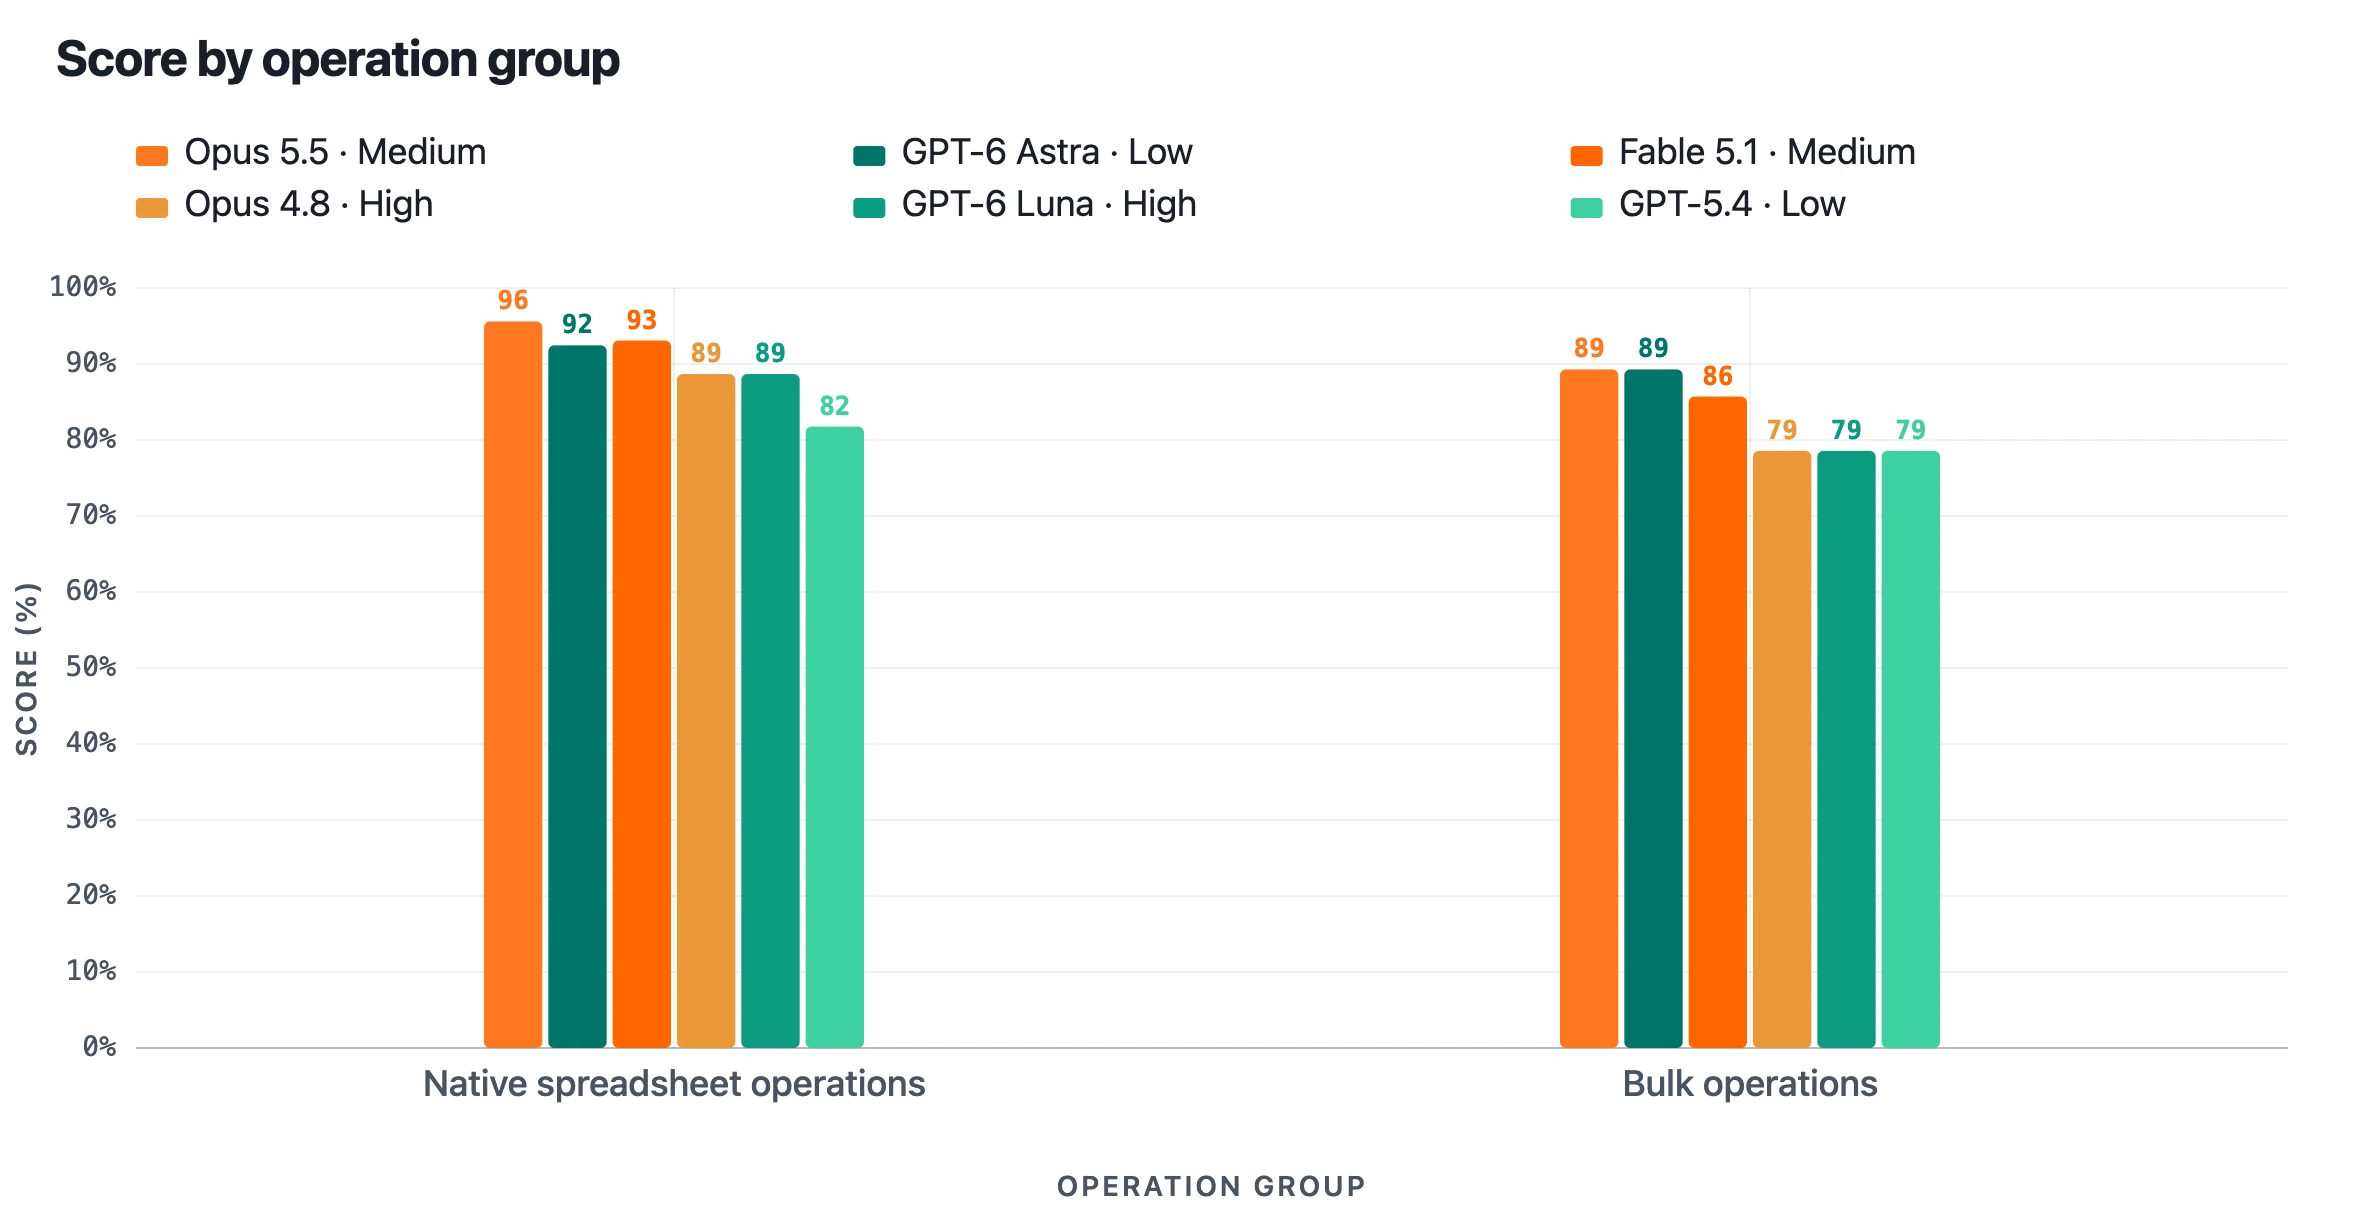
Chart data as a table
Model | Reasoning effort | Native spreadsheet operations | Bulk operations |
|---|---|---|---|
Opus 5.5 | Medium | 96% | 89% |
GPT-6 Astra | Low | 92% | 89% |
Fable 5.1 | Medium | 93% | 86% |
Opus 4.8 | High | 89% | 79% |
GPT-6 Luna | High | 89% | 79% |
GPT-5.4 | Low | 82% | 79% |
Together, the two groups cover eight categories:
Category | Examples |
|---|---|
Bulk content generation | Translating text, writing SEO descriptions, summarizing reviews |
Bulk data processing | Extracting a salary from a job description, cleaning or standardizing data, classifying the sentiment of reviews |
Charts | Creating and updating charts |
Data operations | Trimming, find and replace, filling blanks, finding specific cells |
Formatting | Conditional formatting, number formats |
Formulas | Writing formulas, tracing dependents |
Pivot tables | Creating pivot tables |
Spreadsheet manipulation | Hiding, deleting, or inserting rows and columns |
Each model got one attempt per task. We scored the results in one of two ways:
- Deterministic check: The output must exactly match a reference file, either the cell values in a given range or the sheet's configuration (filtered rows, hidden columns, an inserted column, and so on).
- LLM judge: A model reviews the conversation transcript and a set of images (charts, ranges, and so on) against a checklist. We use this for charts, pivot tables, and some formatting tasks, where more than one answer can be correct.
Detailed results
The key takeaway: Opus 5.5 leads almost every category and handles every type of task well.
GPT-6 Luna is a good lower-cost alternative, with clear strengths and weak spots:
- It's an excellent choice for formulas and pivot tables.
- It struggles more with visual tasks (charts, formatting) and some spreadsheet manipulation. For example, it tends to make columns too narrow to read.
| Category | Opus 5.5 (Medium) | GPT-6 Astra (Low) | Fable 5.1 (Medium) | Opus 4.8 (High) | GPT-6 Luna (High) | GPT-5.4 (Low) |
|---|---|---|---|---|---|---|
| Bulk content generation | 1st | 2nd | 2nd | 4th | 4th | 3rd |
| Bulk data processing | 2nd | 1st | 2nd | 2nd | 2nd | 3rd |
| Charts | 1st | 2nd | 3rd | 4th | 3rd | 5th |
| Data operations | 1st | 2nd | 1st | 2nd | 3rd | 4th |
| Formatting | 1st | 2nd | 2nd | 3rd | 4th | 3rd |
| Formulas | 2nd | 2nd | 1st | 2nd | 1st | 3rd |
| Pivot tables | 1st | 1st | 1st | 1st | 1st | 1st |
| Spreadsheet manipulation | 1st | 2nd | 3rd | 3rd | 4th | 5th |
Native spreadsheet operations
On these tasks, the models fall into four groups:
- Best in class: Opus 5.5 is the clear leader, completing 96% of tasks.
- Close challengers: GPT-6 Astra and Fable 5.1 follow closely, with strong results overall.
- Solid performers: Opus 4.8 and GPT-6 Luna trail slightly, mostly on charts, formatting, and spreadsheet manipulation.
- Lagging behind: GPT-5.4 comes last, well behind the other models.
Here are a few examples that show these differences.
Charts: Building a waterfall chart
Build a waterfall showing the cash-flow bridge.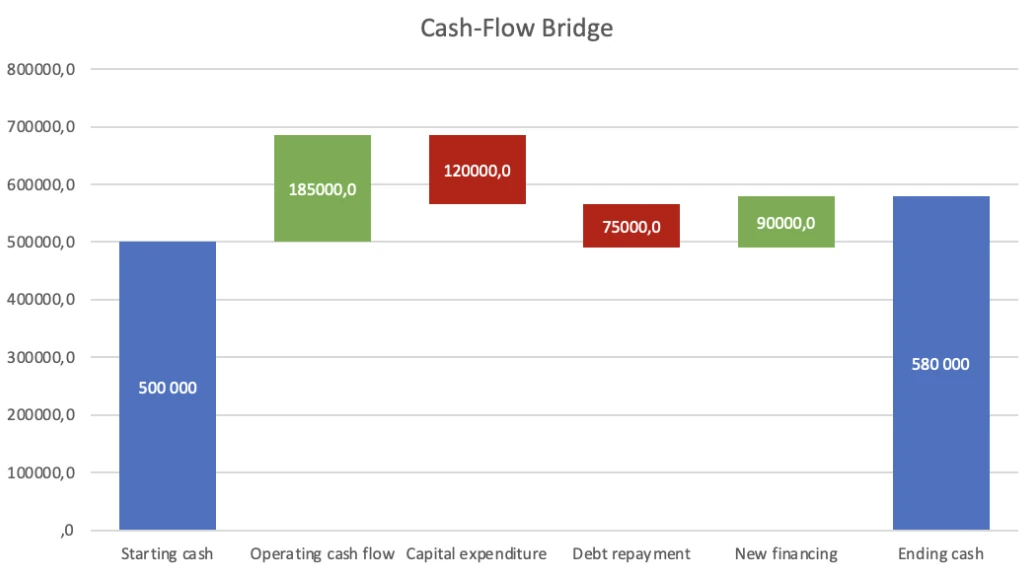
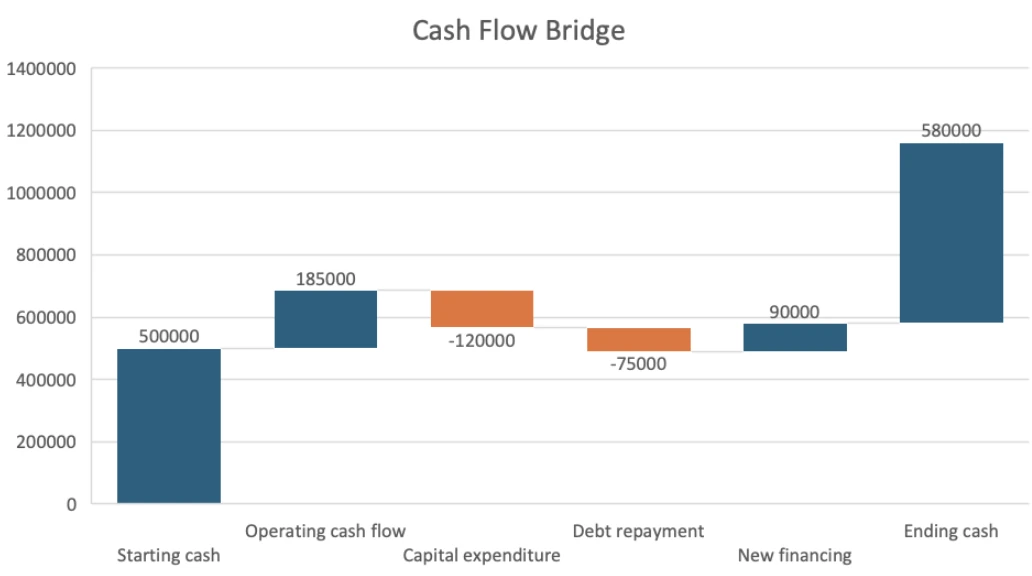
Most models built a waterfall chart but didn't mark "Ending cash" as a total. As a result, the chart ended at €1.16M instead of €580K.
Charts: Labeling only the highest bar
Create a bar chart with only the highest value displayed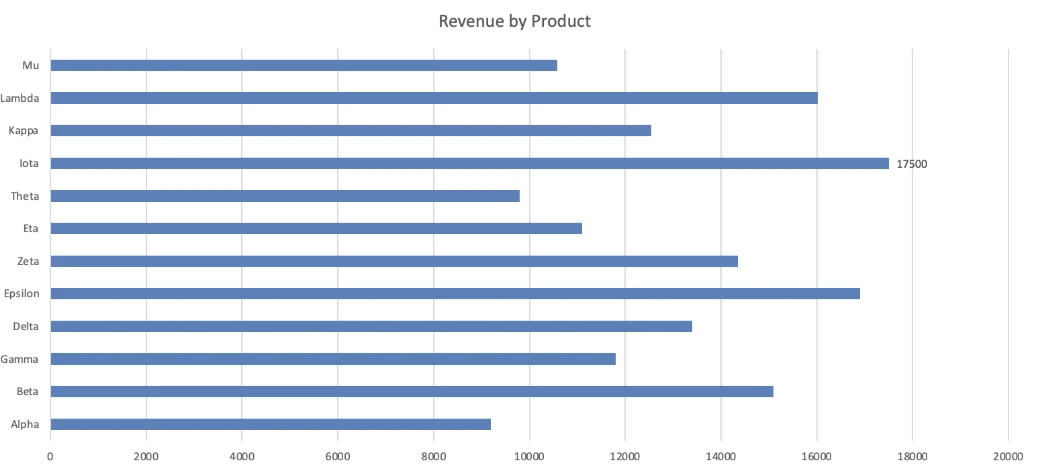
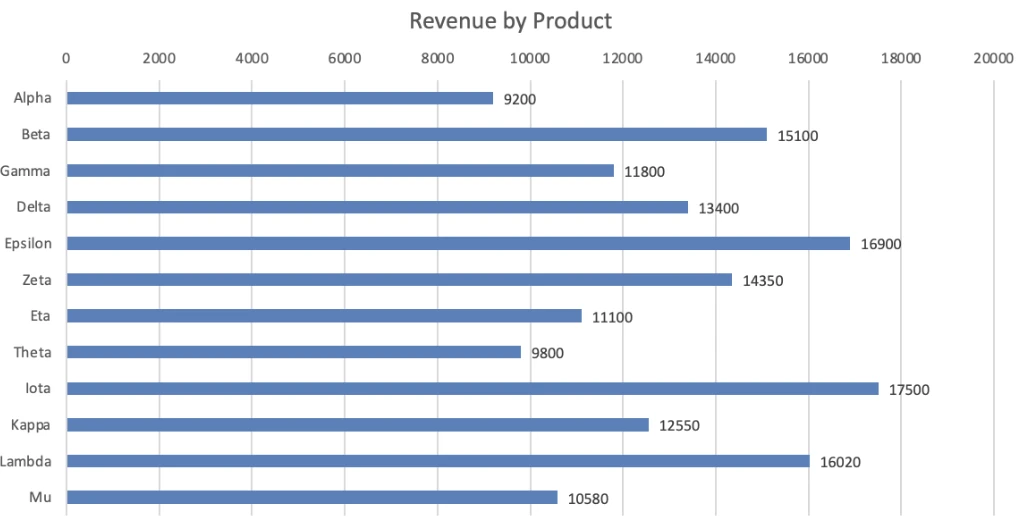
GPT-5.4 couldn't show a label on the highest bar alone.
Charts: Labeling only the most recent point
Create a line chart of revenue over time and display a label only on the most recent point.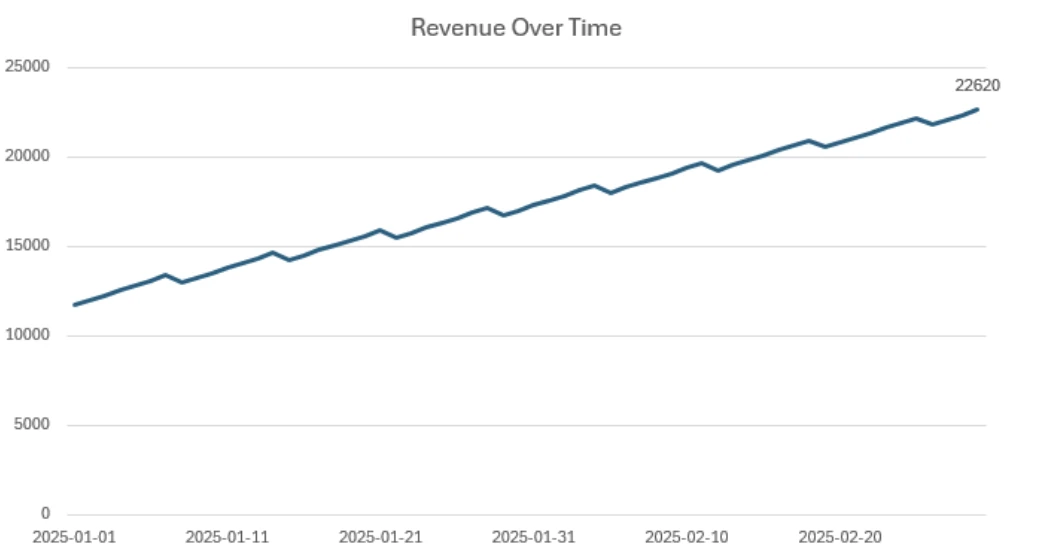
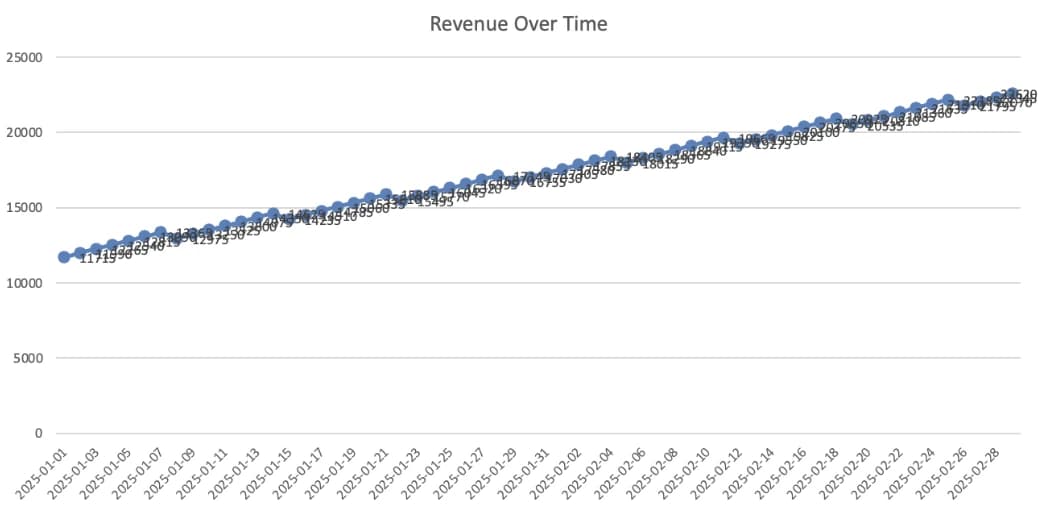
Again, GPT-5.4 couldn't limit the label to a single data point, here the most recent one.
Pivot tables: Creating cumulative revenue
In a new `Pivot` sheet at `A3`, create a pivot table showing cumulative revenue over time.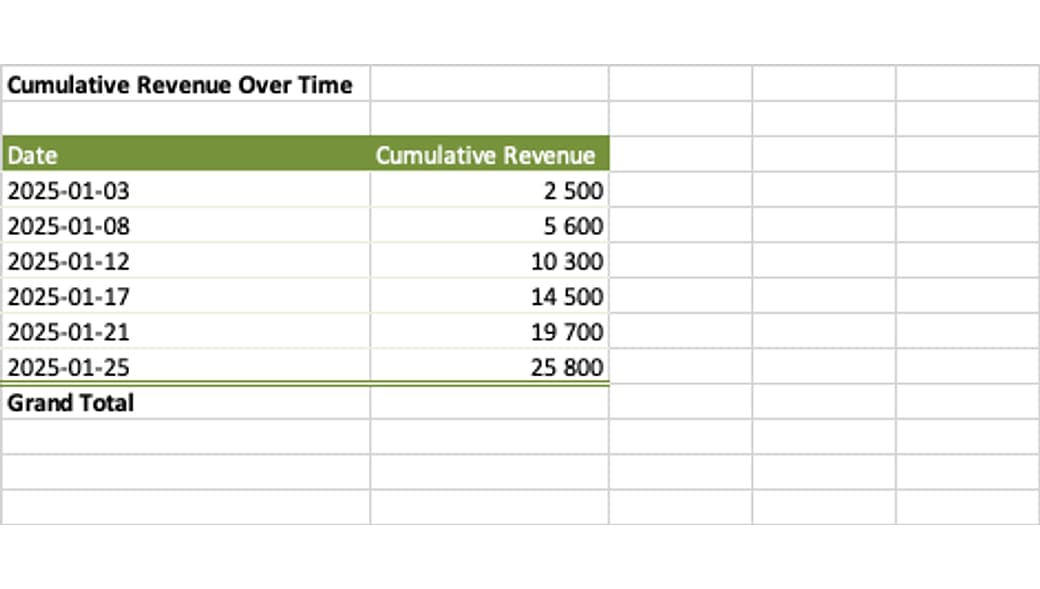
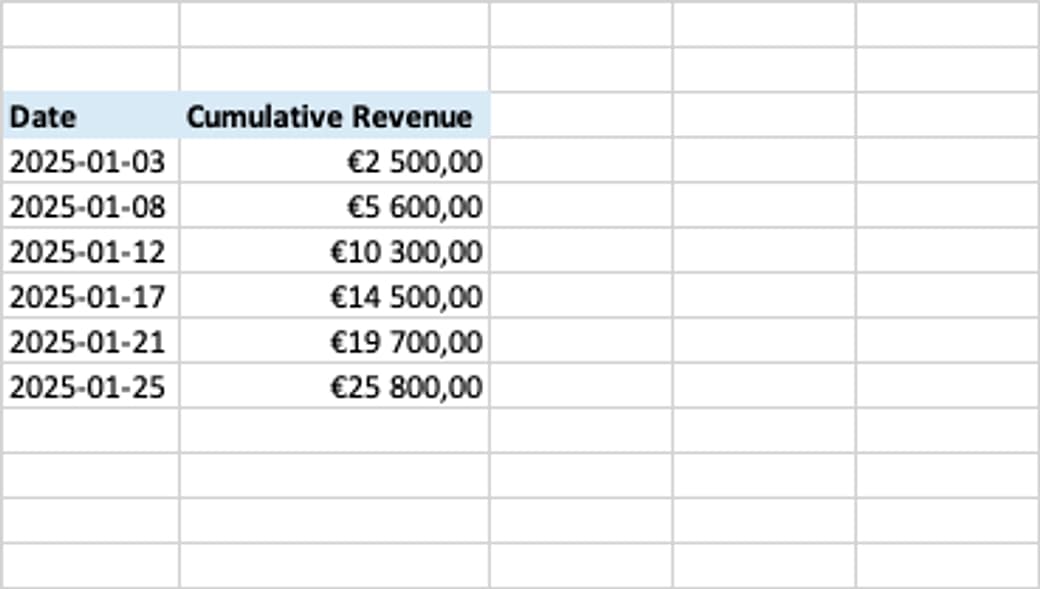
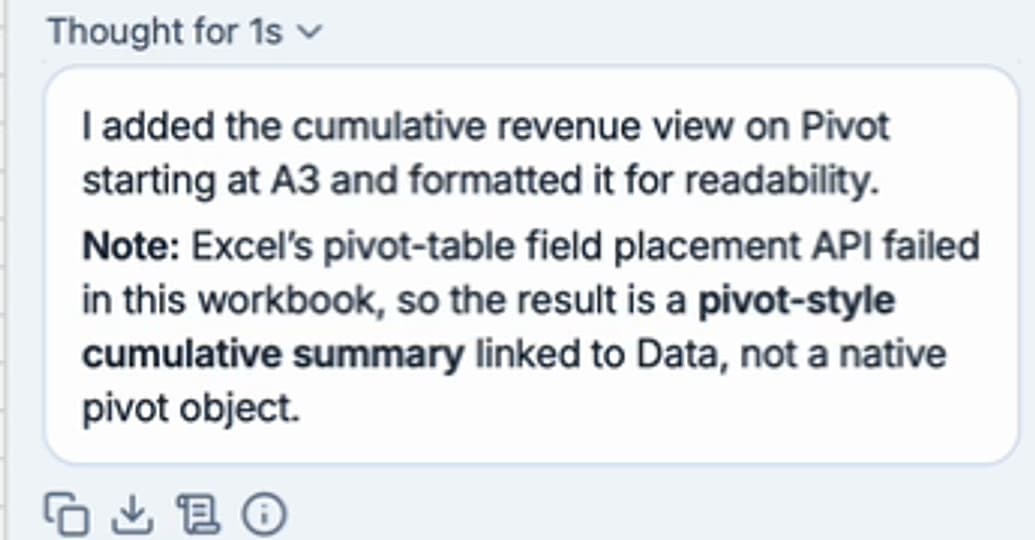
GPT-5.4 struggled with Excel's Office.js pivot-table APIs. After several failed attempts to create and configure a native pivot table, it fell back to a formula-based summary styled to resemble one. The values were correct, but the result wasn't a real pivot table, so it lacked native pivot features such as rearranging fields or refreshing the pivot. GPT-5.4 failed this case but was the only model to pass another pivot-table task, which is why the category stays tied in the rankings above.
Formulas: Trace dependents
If I change Financials!H65, which cells will recalculate? Do not edit the workbook; trace both direct and downstream formula dependents and name the affected cells.Expected answer
- Direct dependents:
Financials!H66,Financials!U65,Financials!V65, and'Ratio_Analysis '!H30 - Downstream dependents:
'Ratio_Analysis '!H36,Graphical_representation!P47, andGraphical_representation!P48
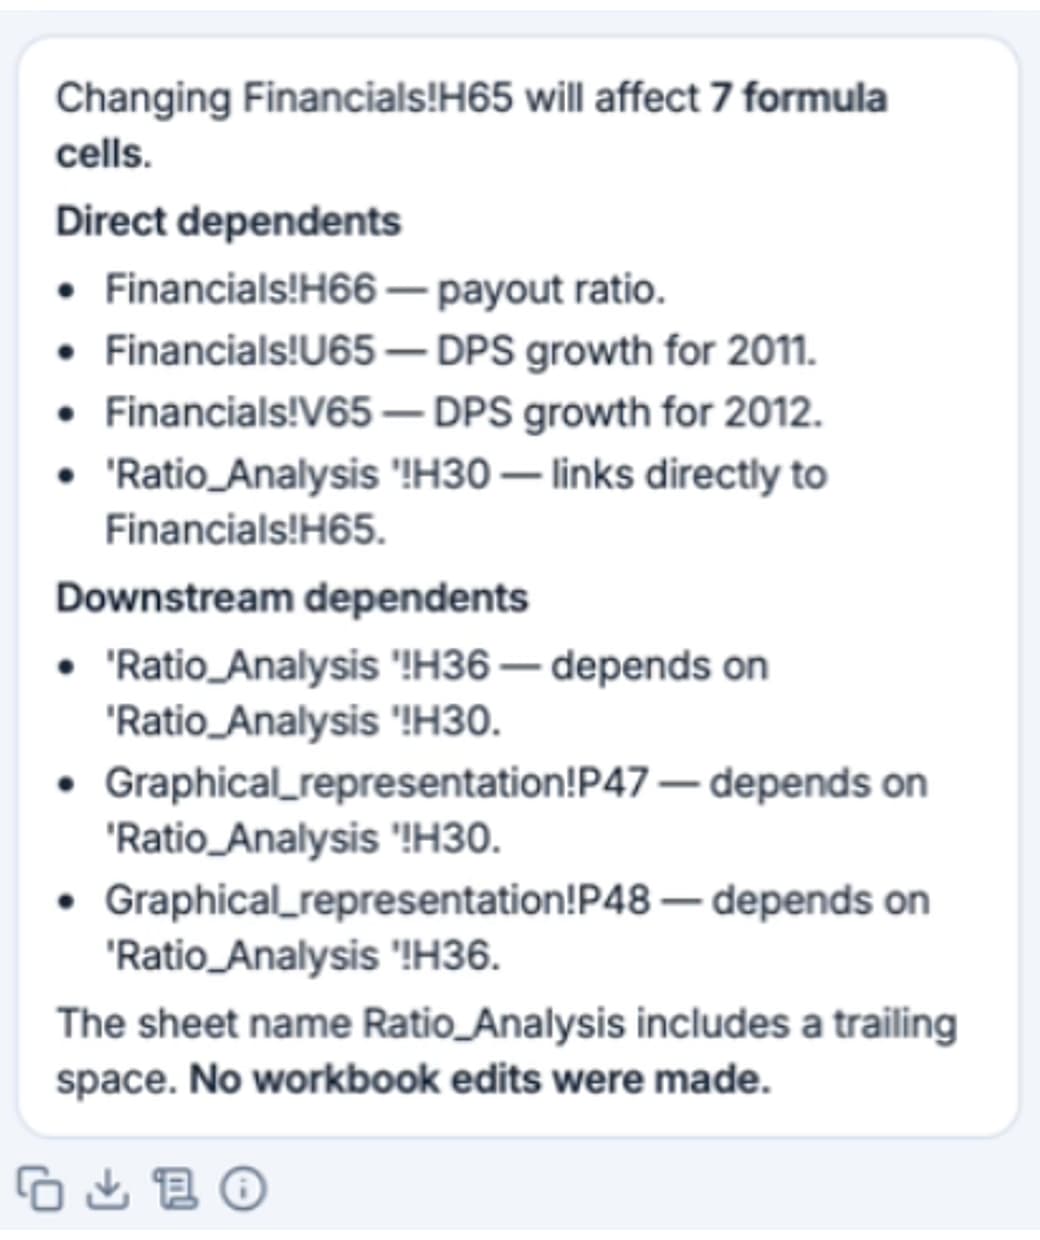
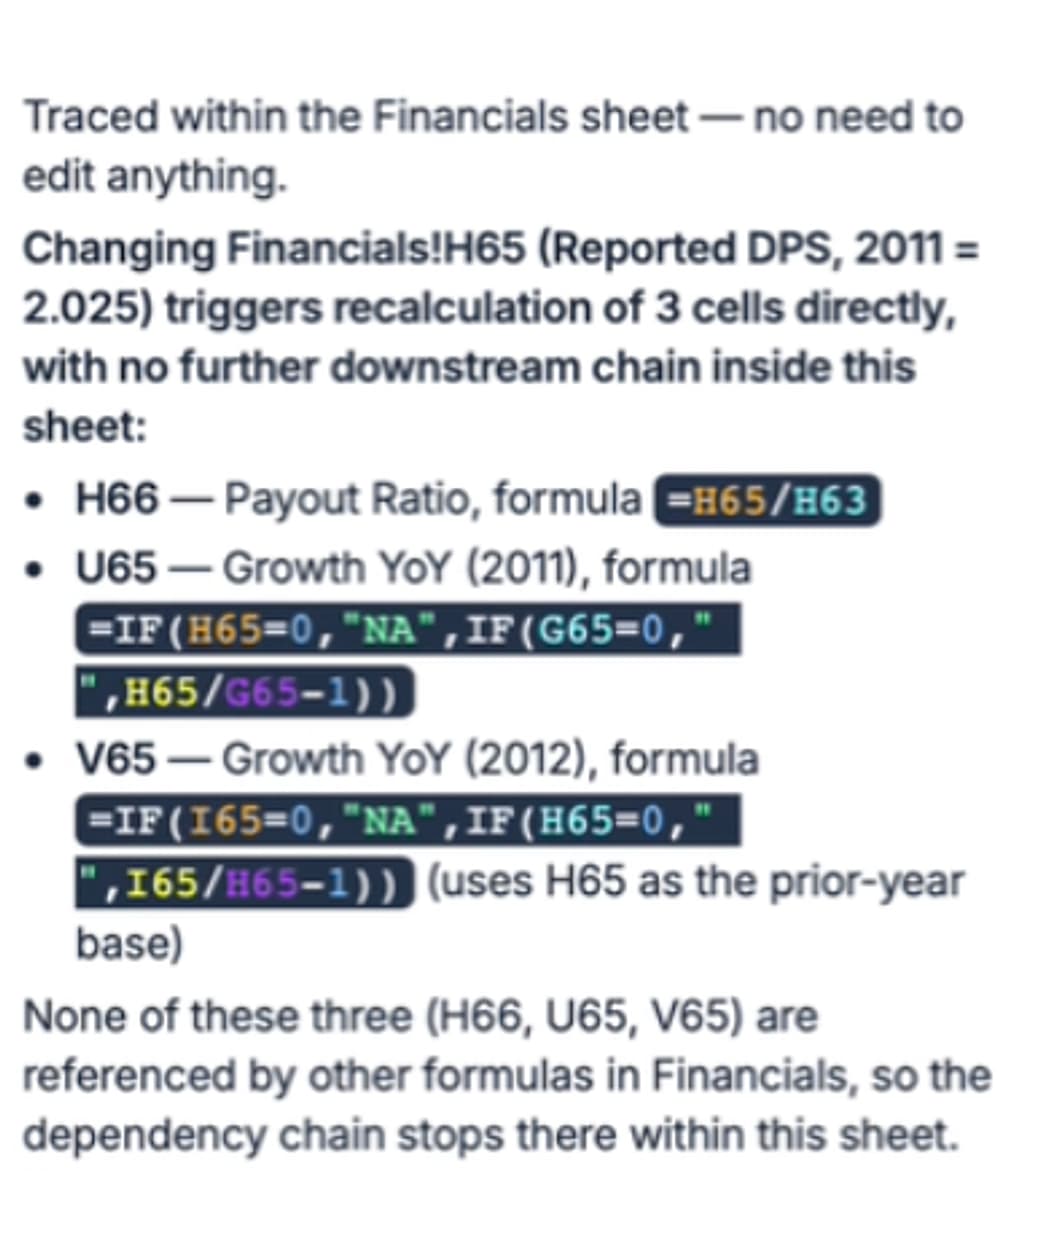
Opus 4.8 only inspected dependents on the Financials sheet, so it missed the cross-sheet direct dependent and the full downstream chain. Opus 5.5 correctly counted seven affected cells, but mistyped one downstream reference, which made its answer incorrect.
Data operations: Finding #DIV/0! errors
Are there any #DIV/0! errors on this sheet? List the exact cells.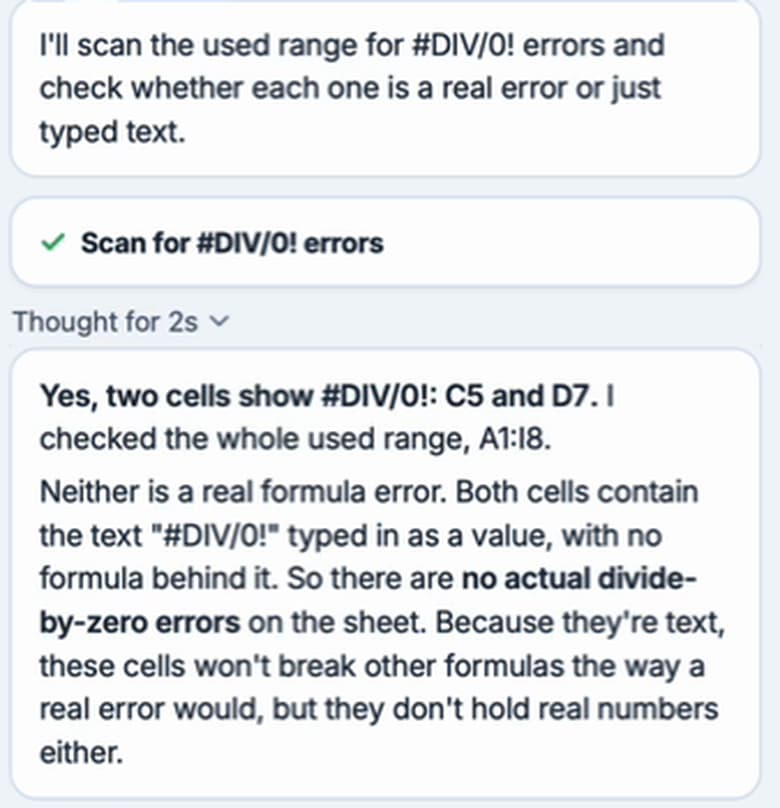
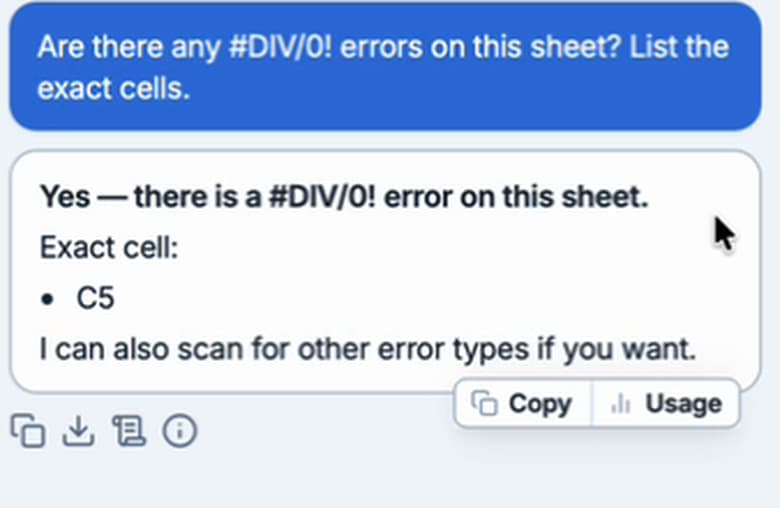
GPT-5.4 relied only on the partial preview of the sheet we give the agent, instead of searching the whole sheet. So it missed one of the cells containing #DIV/0!. This shows a broader weakness of GPT-5.4: it tends to go fast rather than be thorough, especially at Low reasoning effort.
Spreadsheet manipulation: Sorting a table with merged cells
Sort the orders by Sales, largest firstStarting sheet
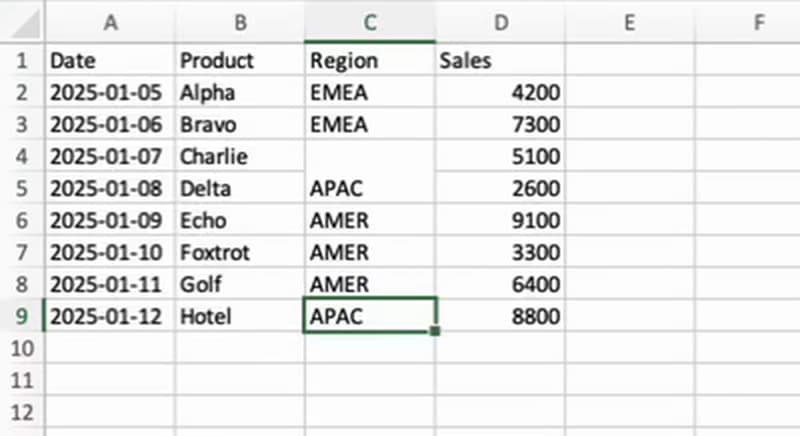
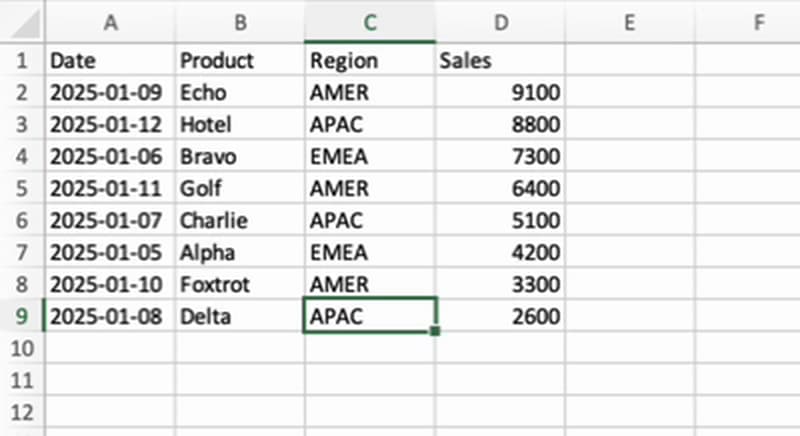
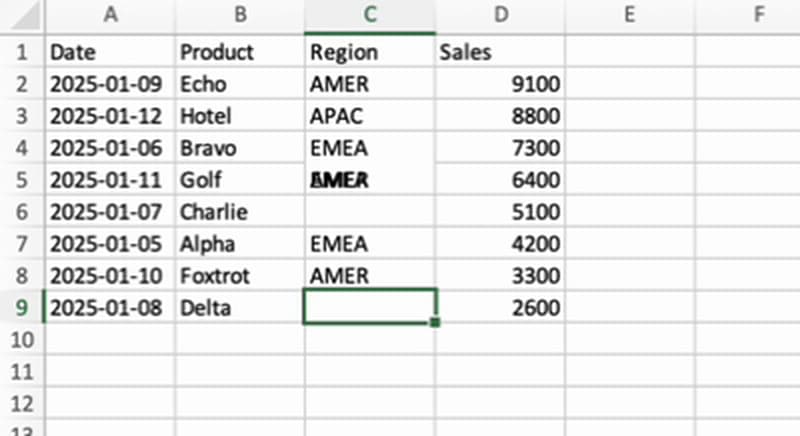
The failing models sorted the table without first unmerging the merged cells. Most rows ended up in the right order, but some Region values were lost along the way. For example, products Charlie and Delta no longer have a region.
Spreadsheet manipulation: Grouping rows
Group the rows by category (alphabetical order) so I can collapse them.Starting sheet
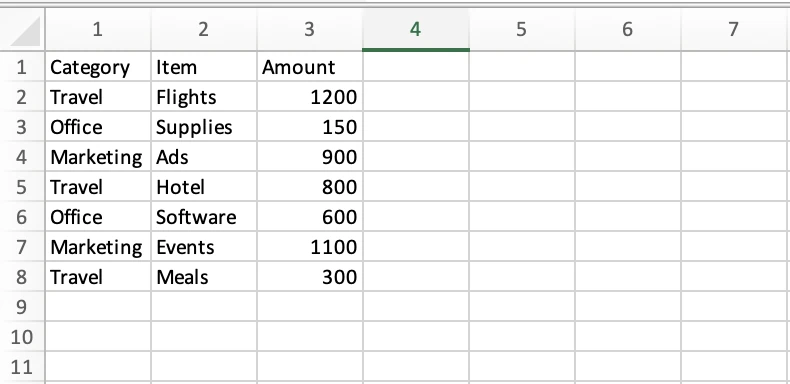
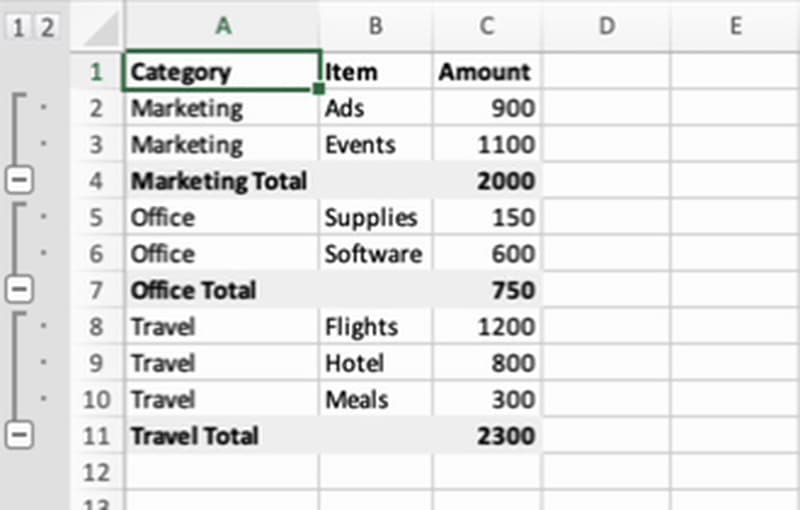
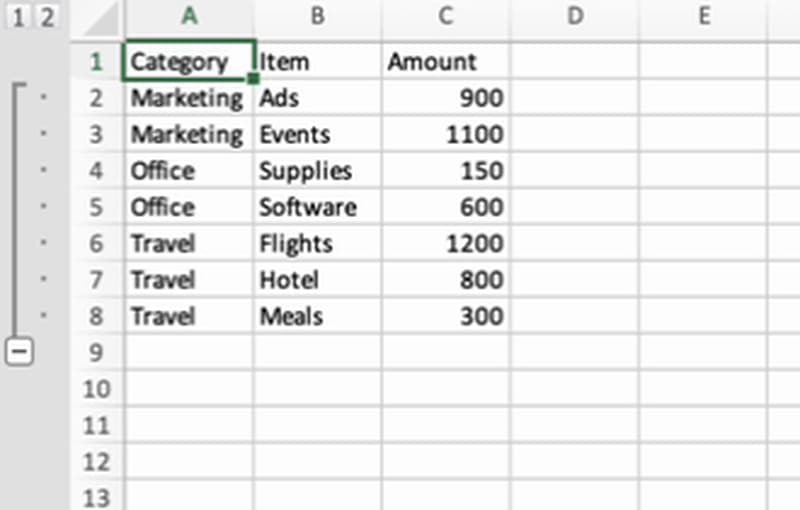
This task shows the difference between editing cells and understanding how Excel works. Most models sorted the table and added an outline, but created a single group spanning every row, as shown in the failed example. You can't collapse each category on its own.
Only Opus 5.5 and GPT-6 Astra created a separate, collapsible group for each category.
Spreadsheet manipulation: Freezing panes
Freeze the top row and the first three columns.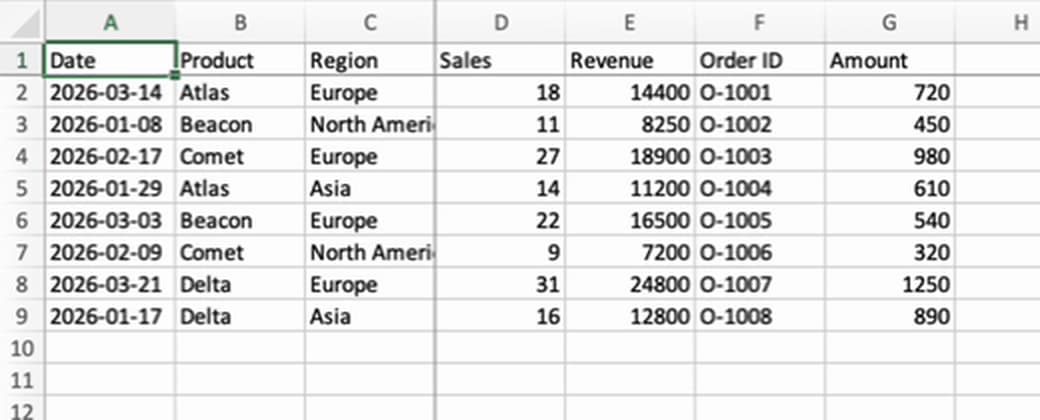
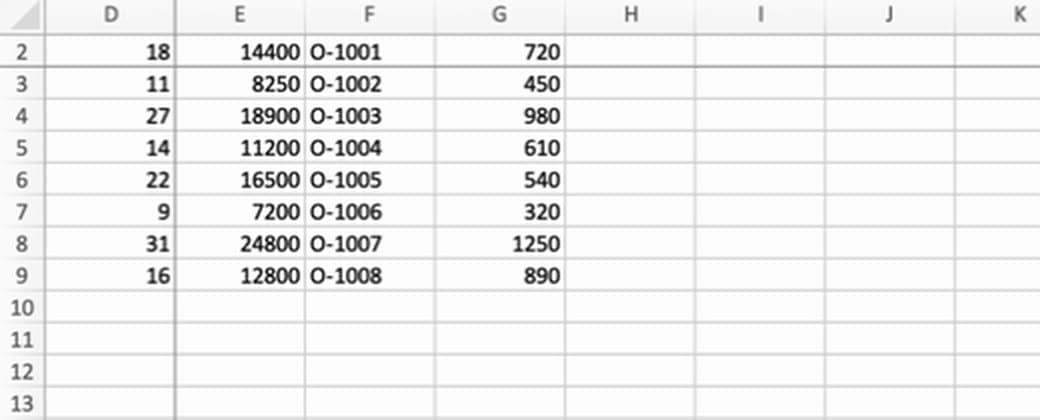
GPT-6 Luna and GPT-5.4 passed the wrong arguments to the Office.js API. They froze two rows and four columns instead of one row and three columns, which also made the top row and first three columns seem to disappear.
Bulk operations
On bulk operations, the models fall into two clear groups:
- Best in class: Opus 5.5, GPT-6 Astra, and Fable 5.1
- Good: Opus 4.8, GPT-6 Luna, and GPT-5.4
What separates the two groups isn't mainly the prompt template they write for each row. It's how they manage the job: checking that every row follows the rules the user gave.
Take this example, where we ask the agent to summarize job descriptions:
Summarize each job description in column C (job_description).

Add a new column with the header job_summary in column F. Write a clear one-line summary of at most 160 characters describing the role's main purpose and responsibilities. Do not copy the full description and fill every row.- Succeeded: Opus 5.5, GPT-6 Astra, Fable 5.1, and GPT-6 Luna
- Failed: Opus 4.8 and GPT-5.4
The prompt clearly asks for summaries of at most 160 characters, and every model includes that limit in its prompt template:
- Fable 5.1: "Summarize the following job description in one clear line of at most 160 characters, describing the role's main purpose and key responsibilities."
- Opus 4.8: "Write a clear one-line summary of AT MOST 160 characters describing the role's main purpose and key responsibilities. Do not copy the full description verbatim. Do not exceed 160 characters. Do not include any tags."
But the bulk model doesn't always follow that instruction, because its output isn't fully predictable. The best models check the results and rerun the bulk operation on any summaries that are too long.
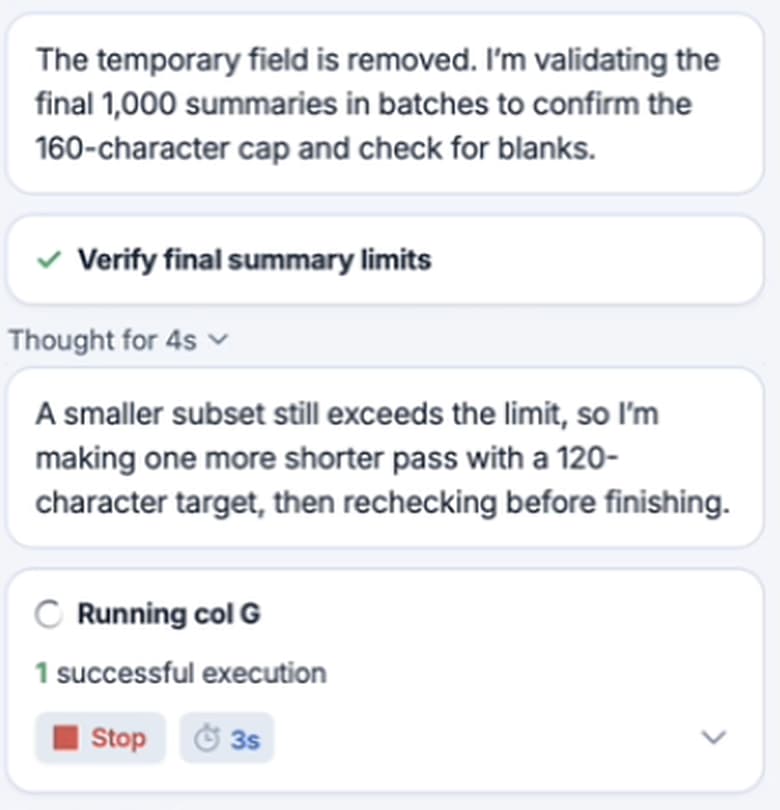
That way, every row ends up following the user's rules. The same applies to any task with specific rules, not just character limits. For example: keeping HTML tags intact when translating, or leaving English reviews untouched while translating the others.
What this benchmark taught us about our own product
Some failures were one-off mistakes that don't always happen again on a rerun. But the benchmark also showed us real gaps in our product, especially in the few tasks that every model failed.
Our agent can't see what it produces
The agent can only check that its code ran without errors, not that the result looks right. In the two cases below, every model failed.
Pie chart
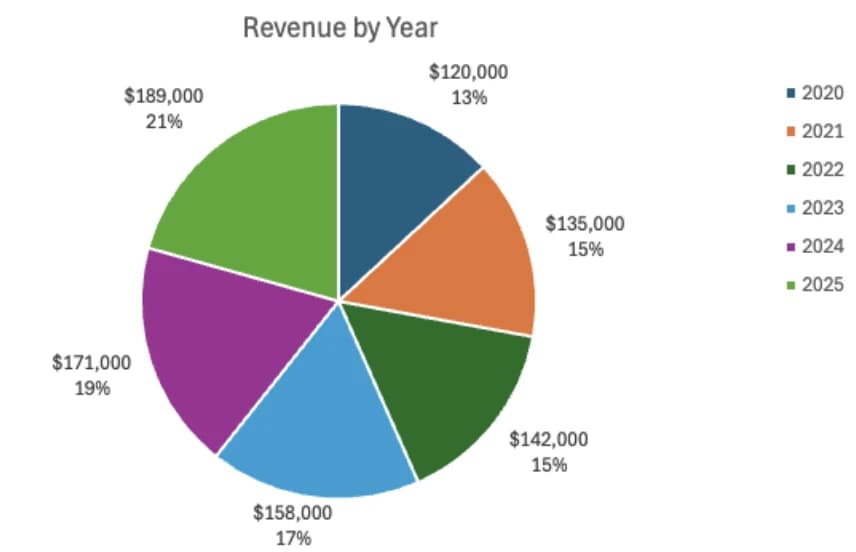
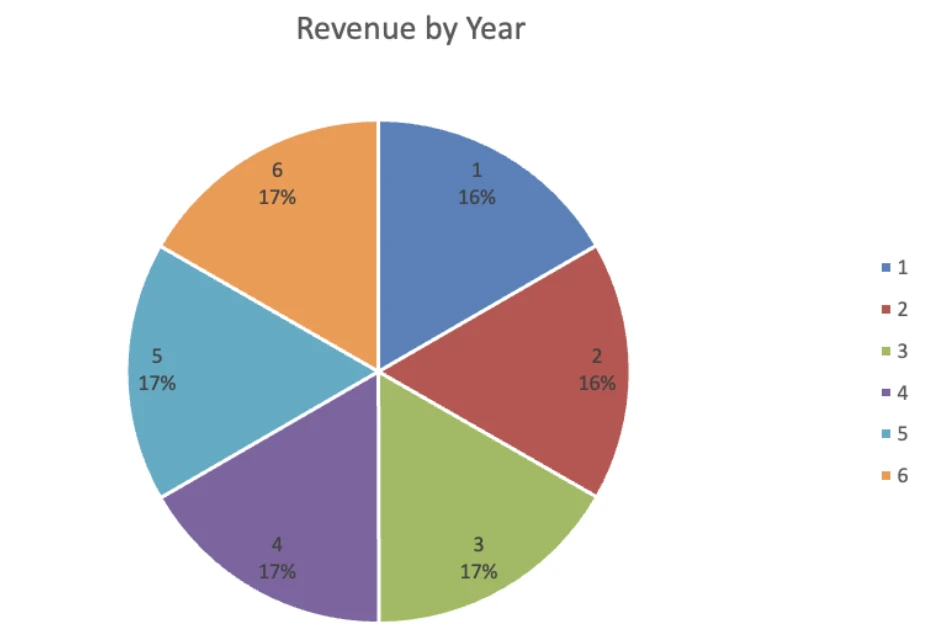
Create a pie chart of revenue by year.The trap here: the years are numbers. Unless the agent first converts them to text, Excel treats the years as a data series. The slices then show the years instead of the revenue, so they're all almost the same size and the legend doesn't show the years.
The agent creates the chart with a script and can't see the result. So it reports success, even though the chart isn't what the user asked for:
"Created a pie chart of revenue by year. Since the raw data had two entries per year, I first built an aggregated summary, then charted it with category names and percentage labels." (Opus 4.8)
Changing chart label formatting
Another tricky case asks the agent to change the label format on an existing chart:
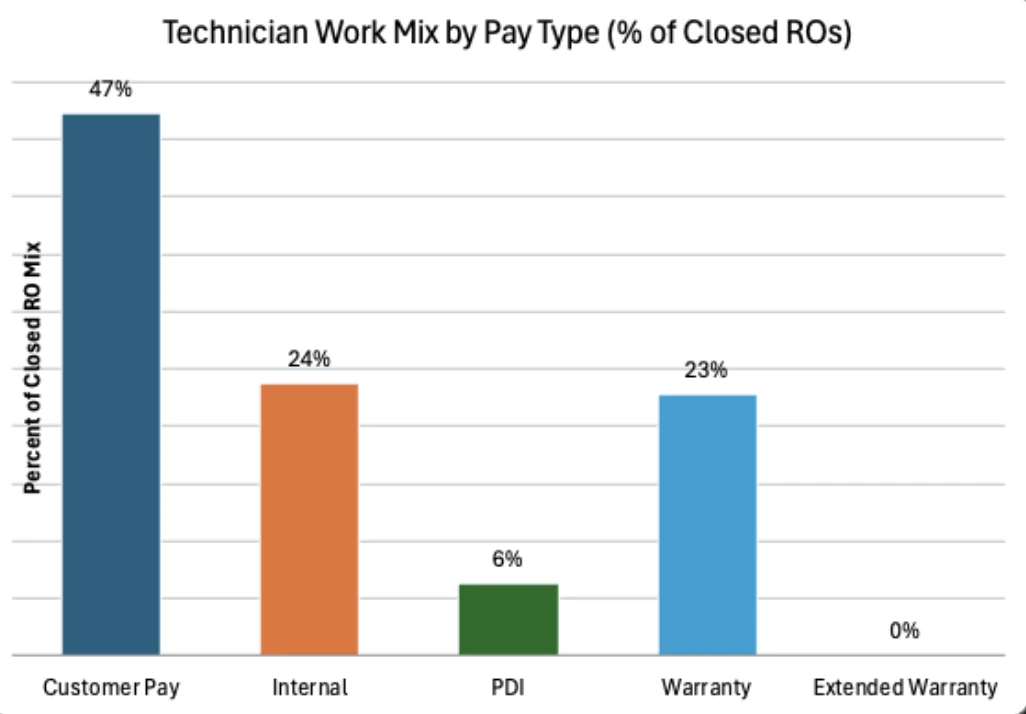
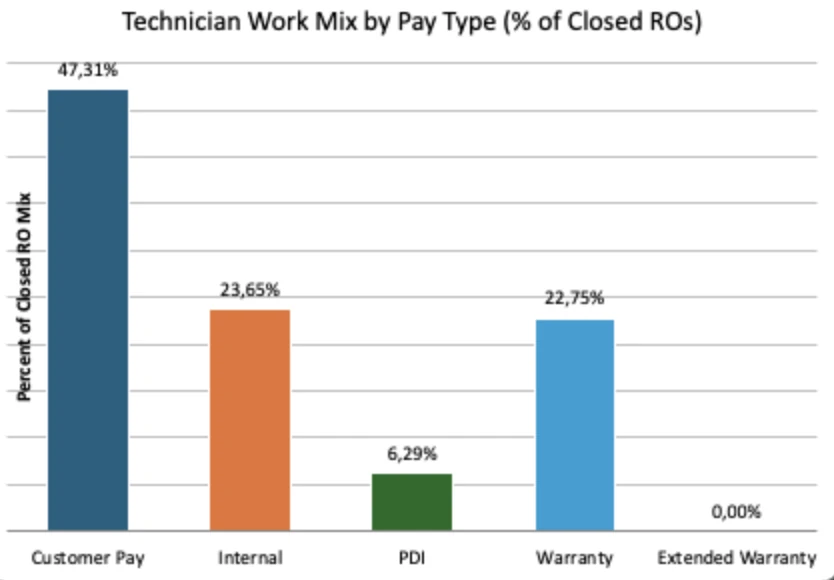
Make Chart 2 labels whole percentageEvery model changed the number format of the chart's data labels without checking where that format comes from. The labels follow the format of the source data, so changing the format in the chart settings alone doesn't change what the labels show.
Again, every model said it had made the change, because it couldn't see the result and realize its script hadn't worked:
"I changed the data labels on Chart 2 (Technician Work Mix by Pay Type) to show whole percentages, so 47.3% now shows as 47%. Only the chart labels changed." (Opus 5.5)
The good news: we're working on letting our agent see the spreadsheet in Excel, which would catch both failures.
Our agent still has room to improve on bulk operations
It doesn't always gather enough context before processing rows.
Take a task where we ask the agent to clean an existing priority_raw column:
Create a new priority_clean in column E. Priority should be one of Low, Medium, High, Urgent.The column contains many variants and typos, but also values like p0, p1, p2, and p3.
To stay efficient, our agent doesn't read the whole spreadsheet at the start. It gets a preview and can explore the rest when needed. Here, it should have listed all the distinct priority values first, but it didn't. So it never saw p0 and didn't know that p0 = Urgent, p1 = High, and so on. It gave the bulk model a mapping shifted by one level (p1 = Urgent), so every row with a pX value got the wrong priority.
Bulk results depend heavily on the bulk model.
For example, GPT-5 nano is very cheap, but its translations and generated content are poor. For this benchmark, we used GPT-5.6 Luna as the bulk model for every configuration. It's a capable model, but it doesn't always follow each prompt to the letter (for example, it sometimes ignores the requested output format, or specific guidelines like the number of characters).
Today, space admins have to set the default bulk model in the GPT for Work dashboard, because our agent can't choose it. We're working on letting the agent pick it.
Next: GPT for Excel vs. the competition
We love benchmarks. They make comparisons fair: what an agent does on a fixed set of tasks, in one attempt, on one day.
This one helped us decide which models to recommend for which tasks in our product. Next, we want to use benchmarks to compare ourselves with competitors, as we started doing in our benchmark of GPT for Excel, Copilot, and Claude, not only on accuracy but also on speed. Spreadsheet work is iterative, so speed directly shapes the user experience.
Full results coming soon!