Monitor your usage
With subscription pricing, each seat comes with its own included usage that resets at the start of each billing cycle, and your space can buy extra-usage credits that are shared across the whole team. Track your usage and remaining extra-usage credits, and generate detailed usage reports, from the GPT for Work dashboard.
Track your usage
Prerequisites
You are the owner or an admin of the space.
-
Sign in to the GPT for Work dashboard with the account that you use for your space.
-
In the sidebar, select Usage.
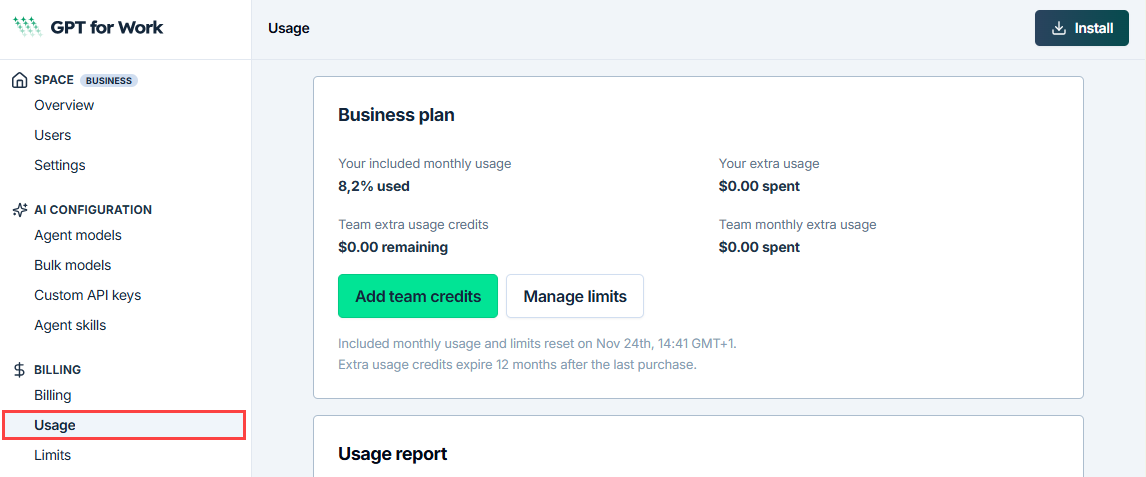
The page shows the following figures:
| Figure | Description |
|---|---|
| Your included monthly usage | How much of your seat's included usage you have consumed, as a percentage. |
| Team extra usage credits | How much is left in the extra-usage credits shared across your space. Available on Business and Enterprise plans. |
| Your extra usage | How much you have spent from the extra-usage credits shared across your space during the current billing cycle. |
| Team monthly extra usage | How much your whole space has spent from the shared extra-usage credits during the current billing cycle. Available on Business and Enterprise plans. |
Generate a usage report
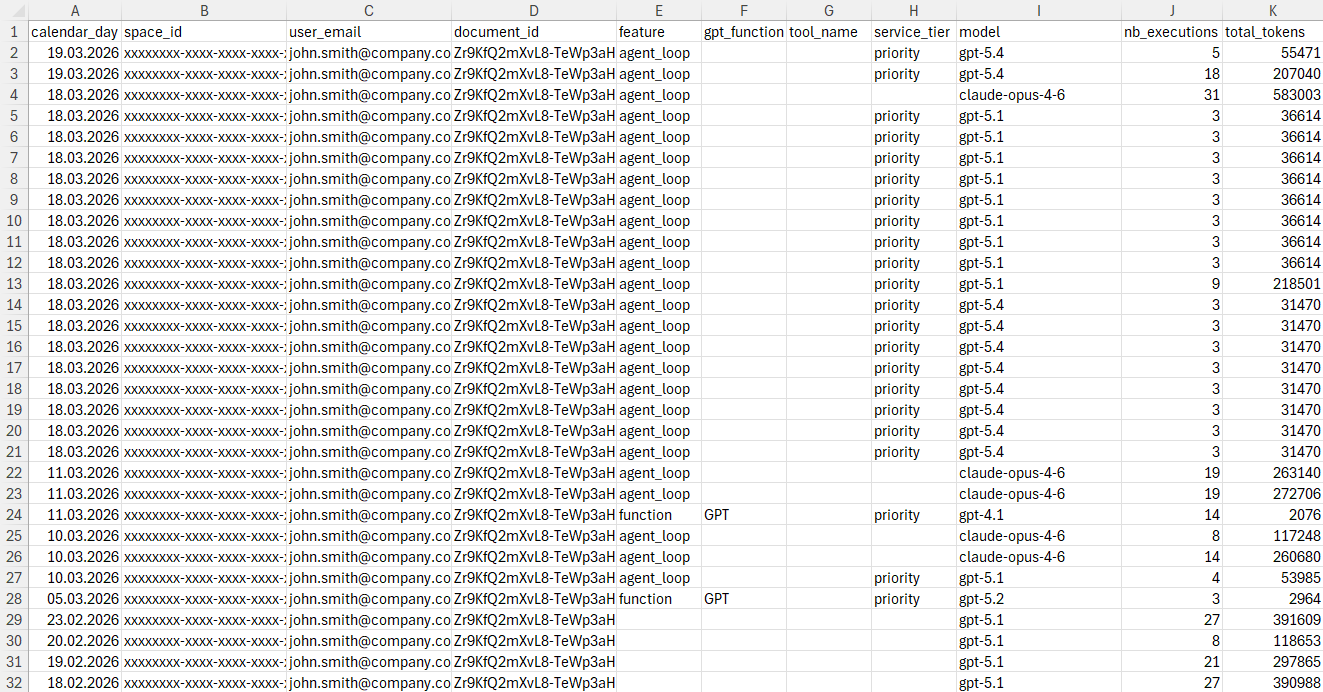
As a space owner or admin, you can generate and download CSV-format usage reports for your space. You can select a predefined time range or define a custom time range for a report. The reports provide detailed per-user information about feature and model usage, token consumption, and credit consumption.
Prerequisites
You are the owner or an admin of the space.
-
Sign in to the GPT for Work dashboard with the account that you use for your space.
-
In the sidebar, select Usage.
-
Select the time range for which you want to generate the report.
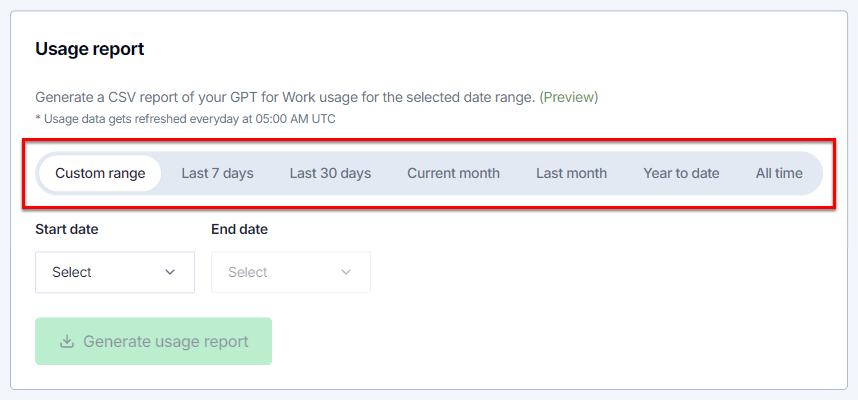
If you want to define a custom time range:
-
Select Custom range.
-
Select Start date.
-
Select End date.
The range is inclusive, so the report will include usage data from both the start date and end date.
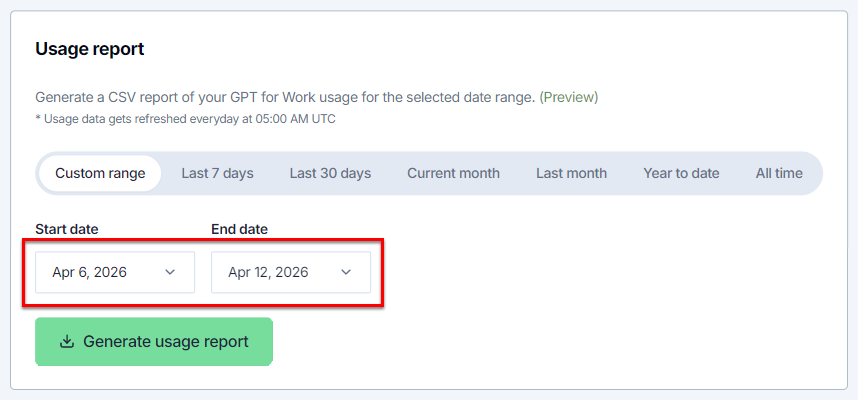
-
-
Click Generate usage report. The dashboard generates the report for the selected time range.
-
Click Download. Your browser downloads the CSV file to your computer.
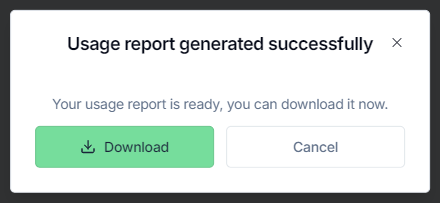
You've generated and downloaded the usage report. You can now view it on your computer.